
- Historical charts display XRP’s descending triangle patterns, mirroring the explosive 2017 breakout pattern, now more than twice as large, fueling bullish sentiment.
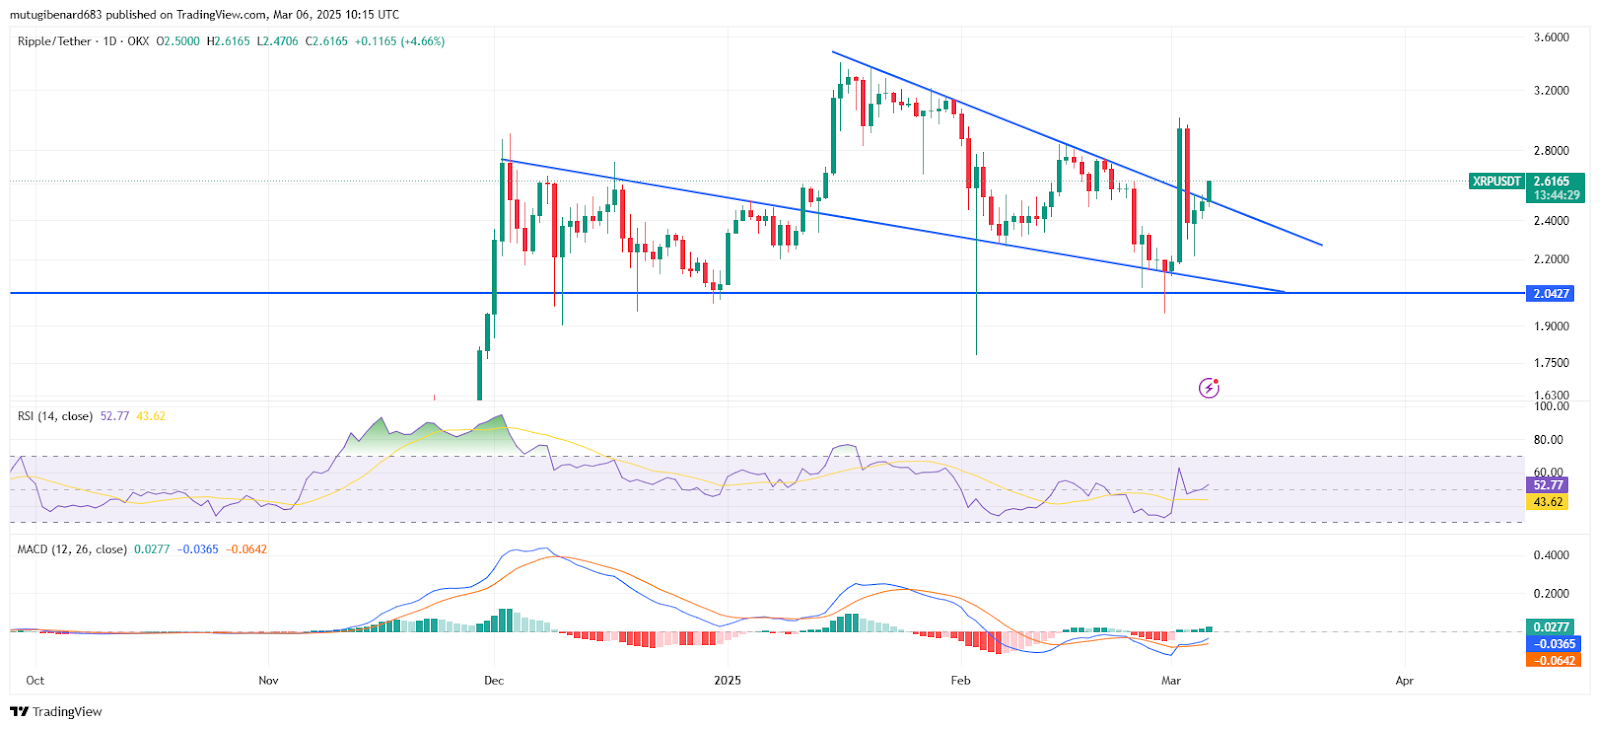
- The MACD bullish crossover and RSI signal buying pressure as technical indicators confirm XRP’s shift from consolidation to an upward momentum phase.
- XRP’s current support at $2.04 and resistance near $2.80 to $3.00 provide clear price targets, guiding traders during this bullish breakout phase.

XRP appears to be in the early stages of a bullish breakout that mirrors the significant 2017 pattern, now more than two times larger. Recent technical analysis and chart patterns suggest the coin may experience a robust upward move.
Chart Patterns and Historical Comparison
The chart displays historical price movement from 2014 to 2025, showing multiple cycles with large parabolic formations. Descending triangle formations indicate prolonged consolidation before breakouts occur.
A tweet from crypto analyst JavonMarks indicated that XRP broke out of a similar pattern in November 2024. The tweet compares this breakout to the notable 2017 structure, noting it is more than twice as large.
Historical charts show a repeating fractal structure that traders use for anticipating bullish reversals. Repeating fractal patterns consistently offer insight into potential price surges for XRP across multiple cycles.
Key Levels and Technical Indicators
XRP recently broke out of a descending wedge formation that signals a potential trend reversal. A key support level of around $2.04 held firm against a further price decline.
Technical indicators confirm bullish signals in the current phase. The RSI stands at 51.71 and is moving upward. Meanwhile, the MACD line crosses above its signal line, and the histogram shows growing buying pressure.
Clear technical markers assist traders in timing entries and exits in the volatile XRP market. Traders rely on these clear technical signals to navigate entry and exit strategies effectively.
Future Price Outlook and Market Sentiment
At writing, XRP was trading for $2.57 with high trading volumes. The currency posted a 3.71% gain in 24 hours and a 15.81% gain in a week.
In case the breakout is sustained, XRP can test resistance levels between $2.80 and $3.00. A pullback to around $2.40 is likely before a further move upwards. A failure to hold above $2.40 can result in a retracement to the $2.04 level.
Market sentiment continues to be cautious with investors awaiting confirmation from these levels for positive movements to hold. Such a setup can be conducive to further positive gains in the event of progressive breakouts in resistance levels.