
- Dogecoin’s chart consistently shows descending wedge patterns with clear, decisive breakouts, indicating potential strong upward momentum driven by recurring technical formations today.
- A prominent support zone between mid-$0.05 and mid-$0.07 repeatedly attracts buyers, serving as a foundation for recovery during downward price consolidations consistently.
- Technical indicators like RSI and MACD offer additional insight as they signal early bullish crossovers and reinforce the chart’s recurring breakout cycles.
Dogecoin has recently captured significant market attention due to recurring descending wedge formations and explosive breakouts. This technical chart analysis has raised expectations for a potential surge, urging experts to closely monitor key support and resistance levels.

Technical Chart Patterns
A tweet from crypto influencer JAVONMARKS states, “Yep, $DOGE (Dogecoin) still looks well on track for a significant surge to new all-time highs above the $0.73905 levels. Currently, that’d consist of an over 261% climb!” The tweet accompanies a chart that shows large downward consolidations forming wedges and triangles. Each gray-marked consolidation precedes an explosive breakout toward higher price levels.
Price action reveals recurring cycles of lower highs and converging lows. A clear falling wedge pattern has emerged since late 2022. Volume declines during consolidation and spikes during breakouts. Technical analysis tracks these phases to gauge potential upward movement.
Support and Resistance Zones
A purple rectangle marks a broad support area between mid-$0.05 and mid-$0.07. This zone has repeatedly attracted buyer interest during price pullbacks. It serves as a safety net amid downward pressure.
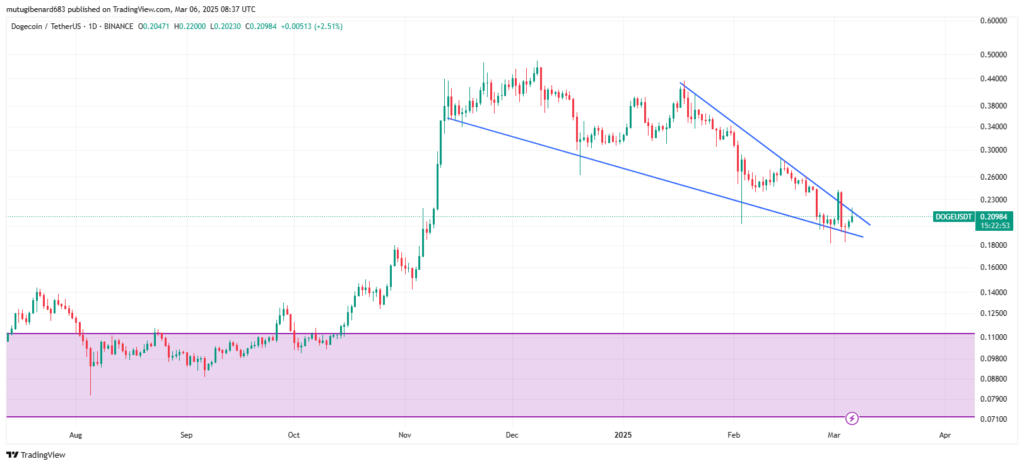
Upper resistance levels are identified from recent swing highs in December and February. A clear daily close above the descending trendline may trigger a breakout. Failure to maintain the breakout could lead to a retest of support. Traders use these key levels to plan entry and exit strategies.
Market Sentiment and Technical Indicators
Technical indicators offer further insight into Dogecoin’s price dynamics. The Relative Strength Index currently remains near the mid-40s. The Moving Average Convergence Divergence shows early signs of a bullish crossover. These signals support the recurring breakout cycles observed in the chart.
Dogecoin traded at $0.214 with a 24-hour volume of over $1.5 billion at the time of writing. The token has increased by 7.43% over one day. It has risen by 3.21% over the past week. Market experts monitor these formations closely amid broader crypto trends. The technical setup is monitored by seasoned professionals in the crypto space.