
- CryptoBullet’s analysis confirms Solana completed a five-wave Elliott cycle, culminating in a blow-off top near $300 before clear correction signs emerged.
- The analysis forecasts a B-wave bounce reaching the 0.618 Fibonacci level between $200 and $220, followed by a steep drop to $40.
- RSI divergence appears as Solana forms higher highs while RSI records lower highs, supporting technical trends with a current price near $143.93.
Technical analysis of Solana suggests the coin may be nearing a market correction. Evaluations using Elliott Wave theory and Fibonacci retracement techniques indicate potential downward price adjustments after a strong upward impulse.
Elliott Wave Analysis
The analysis identifies a clear five-wave cycle on Solana’s chart. Waves one and two recorded an initial move and a corrective phase during 2022. Wave three showed a strong parabolic rise followed by a minor pullback in wave four. This structure helps traders understand market rhythm during bullish moves.
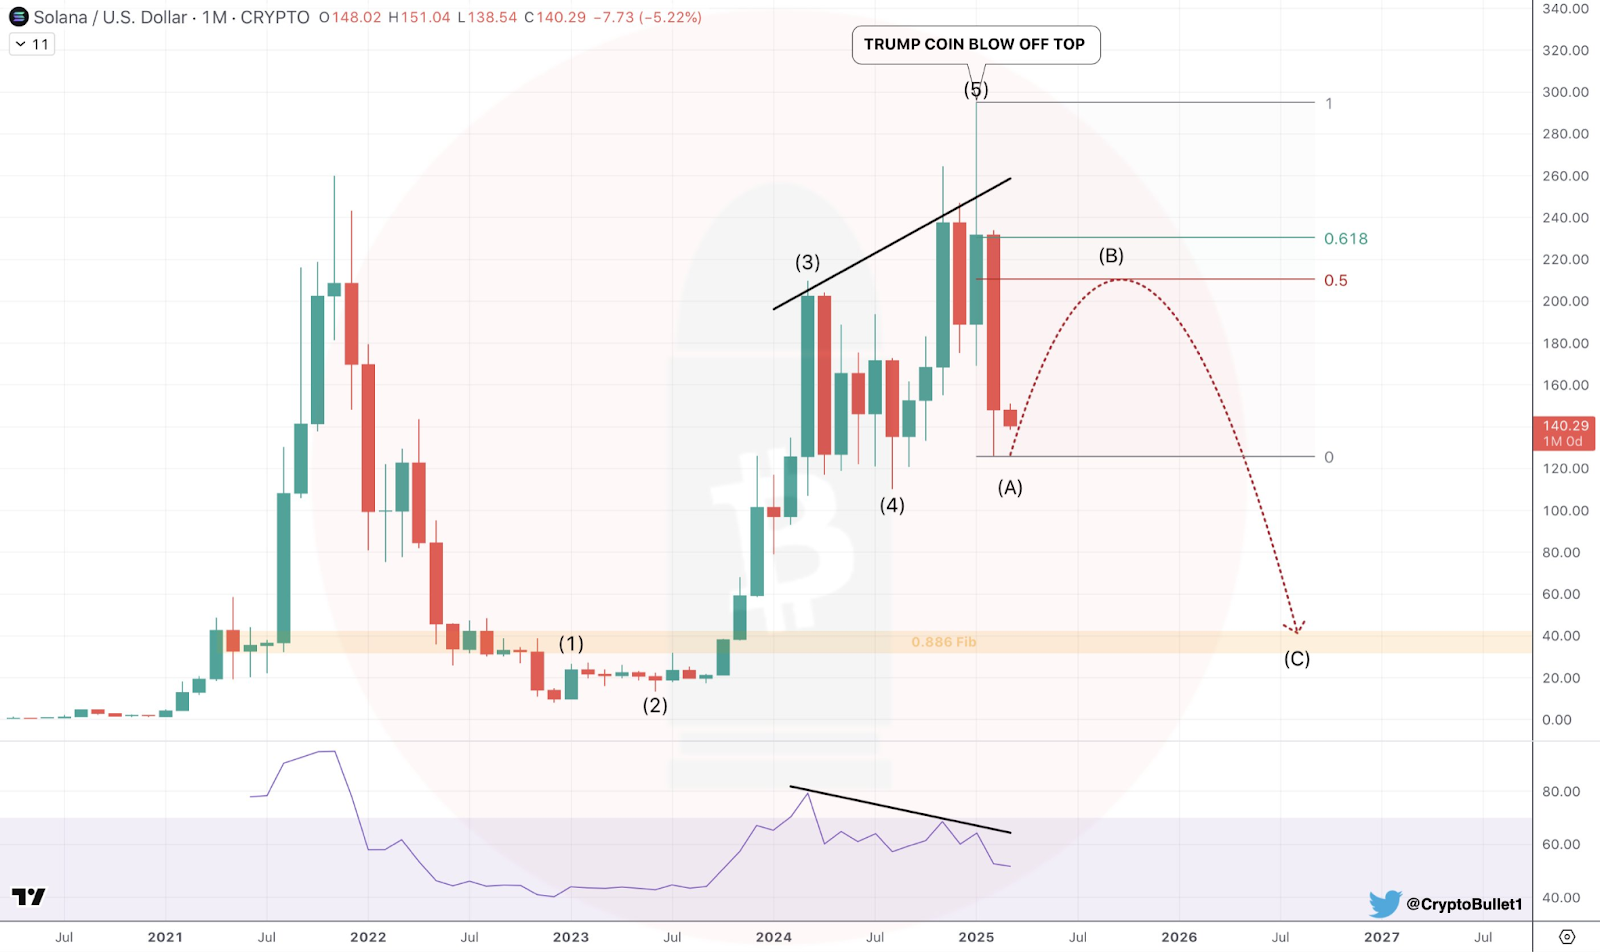
Wave five reached a peak, noted as a blow-off top near $300. CryptoBullet shared these observations on Twitter. The tweet details the five-wave impulse and suggests the current bullish phase may have ended. Traders rely on these patterns to identify reversal points and manage risk effectively. The cycle conforms to standard Elliott Wave principles used in technical analysis.
Fibonacci Retracement and Correction
Technical tools indicate an ABC corrective structure is now in progress. The A-wave has already begun, leading to a rapid price drop. This phase signals a shift from the recent upward run. Analysts monitor such corrective patterns to track market adjustments during volatile periods.
The analysis predicts that a B-wave bounce may reach the 0.618 Fibonacci retracement level, estimated between $200 and $220. The following C-wave is expected to push prices down to a target near $30 to $40. These retracement levels are closely watched by experienced traders. Analysts use these retracement points to predict market behavior during corrections.
RSI Divergence and Market Data
The relative strength index shows a bearish divergence. Solana’s price formed higher highs while the RSI recorded lower highs. This divergence suggests weakening momentum among traders and a shift in market sentiment. Technical indicators like these often guide entry and exit decisions. Market data places Solana at approximately $143.93 at press time. A 24-hour trading volume nears $2.84 billion, supporting these technical findings. The coin increased by 0.98% today despite a 15.98% decline over the past week. Historical data in crypto markets often aligns with such RSI patterns.