- Pumpfun’s massive SOL deposits to Kraken add selling pressure, impacting Solana’s market sentiment and short-term price action.
- Solana’s price retraced to $138, testing key $124 support; a breakdown could lead to further losses, while a rebound may spark recovery.
- Historical trends show Solana’s cyclic patterns, where deep pullbacks precede accumulation, hinting at a potential buying opportunity.
Pumpfun recently transferred 87,787 SOL ($12.58M) to Kraken, marking another significant deposit. So far, Pumpfun has deposited 2,433,286 SOL ($485.7M) to Kraken at $200. Additionally, it sold 264,373 SOL for 41.64M USDC at $158. With a total gain of 2,994,243 SOL ($426M), these activities continue to impact market sentiment.

Solana’s Market Performance and Price Movements
Solana’s price chart on Binance illustrates a volatile history. It surged to an all-time high before facing a sharp 96.62% drawdown. This steep decline wiped out 250.95 points from its value between late 2021 and mid-2022. Consequently, a prolonged consolidation period followed. The price remained stagnant for months before a recovery trend began in 2023.
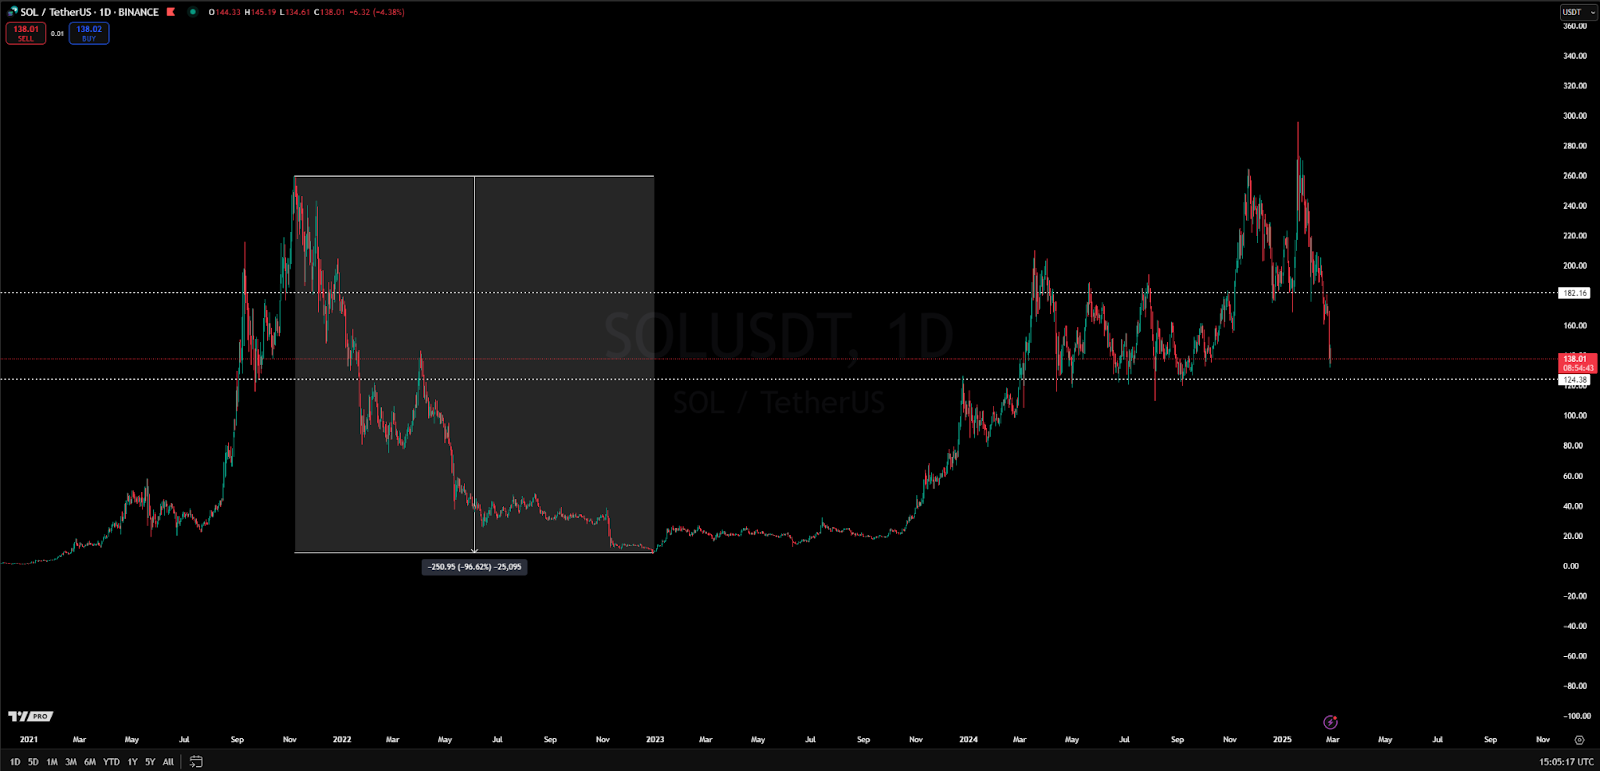
Since then, Solana has shown a steady uptrend, breaking key resistance levels. However, recent market action has introduced fresh selling pressure. SOL reached a new peak in early 2024 but has now retraced, trading at $138. The nearest support level lies at $124, a critical zone for market participants.
Technical Indicators and Market Sentiment
The data highlights key resistance near $182 and crucial support at $124. Recently, Solana failed to sustain above the higher resistance, triggering a sell-off. The latest daily candle reflects a 4.38% drop, signaling strong bearish momentum. Besides, increased volatility, as indicated by the current price action, may have an impact on short-term market patterns..
Moreover, historical patterns indicate that Solana follows cyclical movements. Each rapid surge has been met with deep retracements, leading to new accumulation phases. Hence, the current decline might resemble previous corrections, offering a potential buying opportunity if support holds. A breakdown below this support could trigger further downside. Conversely, a rebound from this zone may reinforce bullish continuation.