
- TURBO’s 8-hour chart shows a falling wedge, historically leading to a breakout 70% of the time, with a 50% rally possible.
- The selling pressure continues to weaken as indicated by MACD while RSI shows an oversold position at 36.48 thus enhancing the potential for TURBO to rally.
- The price of TURBO might reach $0.004530 if it breaks out but a failed attempt could result in a drop to $0.0028 which may lead to additional downward movement.
According to World Of Charts analyst, the 8-hour candlestick pattern for Turbo/USDT on Binance is showing a clear falling wedge formation. The price has been consolidating within the wedge, respecting both the descending resistance and support trendlines.
Currently, the price is at $0.003021, with a recent 2.02% increase. The resistance trendline is sloping downward, while the support trendline is also trending lower but converging towards a breakout point. Historically, falling wedges lead to a breakout 70% of the time, and in this case, a successful breakout could result in a 50%+ rally.
A measured move from the wedge breakout suggests a potential price target of approximately $0.004530, marking a 39.77% increase from the current price level. Thus,If the breakout fails, the price could retest lower support levels near $0.0028, risking further downside pressure. However, if bullish sentiment prevails, Turbo/USDT could witness an accelerated upward rally, validating the falling wedge pattern’s bullish implications.
TURBO Gains 2.4% as Buying Pressure Increases
Currently,Turbo (TURBO) is trading at $0.003179, reflecting a 2.69% increase in the last 24 hours. The trade prices fluctuated between $0.003025 and $0.003332 thus showing average market volatility. The price of TURBO in BTC reached 0.00003623 BTC with a 4.2% increase alongside ETH displaying 0.00001308 ETH at a current 2.5% growth rate which indicates rising TURBO demand from buyers.
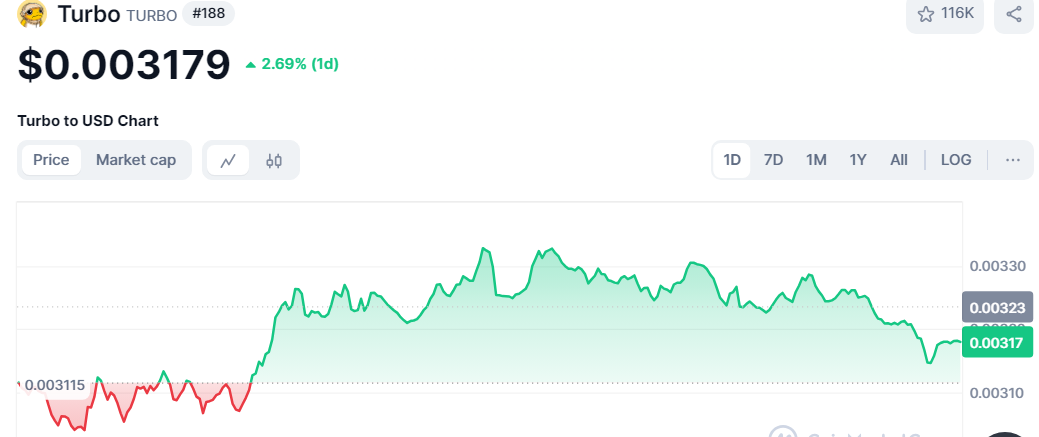
Market implications suggest that TURBO is gaining traction, possibly driven by investor confidence or market trends. Further bullish pressure could drive more price gains within the token market but a change in market sentiment could trigger downward movements.
The TURBO/USD 24-Hour chart Signals Bullish Reversal
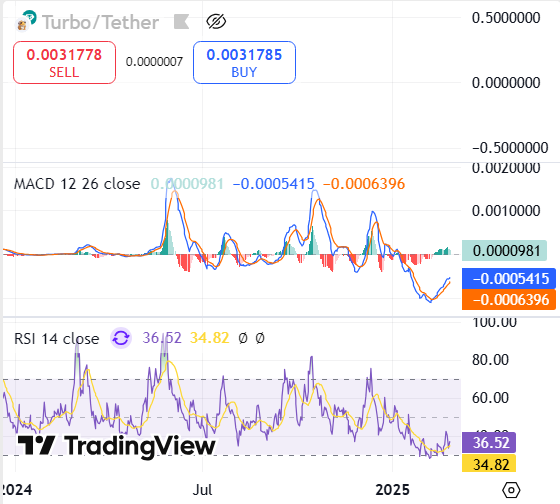
The (TURBO/USDT) 24-Hour chart indicates a period of moderate volatility, with the price fluctuations within a narrow range. Bullish price activity seems to be emerging based on the MACD indicator because its lines show a minor positive shift to 0.0000979 yet the signal line maintains its negative value at -0.0005418.
The current condition indicates a possible decline of selling force while suggesting an upcoming bull crossover which should establish an uptrend. TURBO currently shows an RSI value of 36.48 which indicates the token stands in an oversold area suggesting it may be undervalued before experiencing price recovery.