
- Hidden bullish divergence in Bitcoin indicates a possible bounce in price, as lower lows in RSI accompany higher lows in price.
- Breaking down below the lower Bollinger Band signals extreme selling pressure, but an oversold Stochastic RSI suggests a short-term market rally.
- Traders eyeing $91,987 support; bears eyeing $80,000 – $82,000 in case of a continuation of the downward trend.
The Bitcoin price action has confirmed a hidden bullish divergence, a pattern in the past correlated with strong upward movements in the crypto market. The analysts assert similar patterns have been preceded by major uptrends, which have impacted not only Bitcoin but other cryptocurrencies in the entire market.
Hidden Bullish Divergence and Support Levels
Crypto expert JavonMarks made this observation in a recent tweet, noting Bitcoin is following a hidden bullish pattern which previously led to one of the strongest market rallies. The post suggests, in the case of events repeating themselves, Bitcoin and other alts can make substantial profits.
The upward-sloping trendline, which connects a series of higher lows, is shown in the chart. The RSI shows a concealed bullish signal in which it makes lower lows, as Bitcoin’s price makes a series of higher lows. This pattern, in its historical past, has indicated a continuation of an existing uptrend.
The market price was at $88,907.28 at the time of writing, which reflects a slight 0.01% increase in the past 24 hours, though a 6.94% depreciation in the past week. If buying returns, Bitcoin can see a rally towards levels of major resistance.
Technical Indicators and Market Sentiment
The Bitcoin price broke down below the lower edge of the Bollinger Bands, which is a signal of extreme bearish pressure. The major resistance is set at $91,987.71, and there is active resistance in position by the middle band of $95,645.45. The lower band of $90,399.99 is a point of vital support where buying can occur.
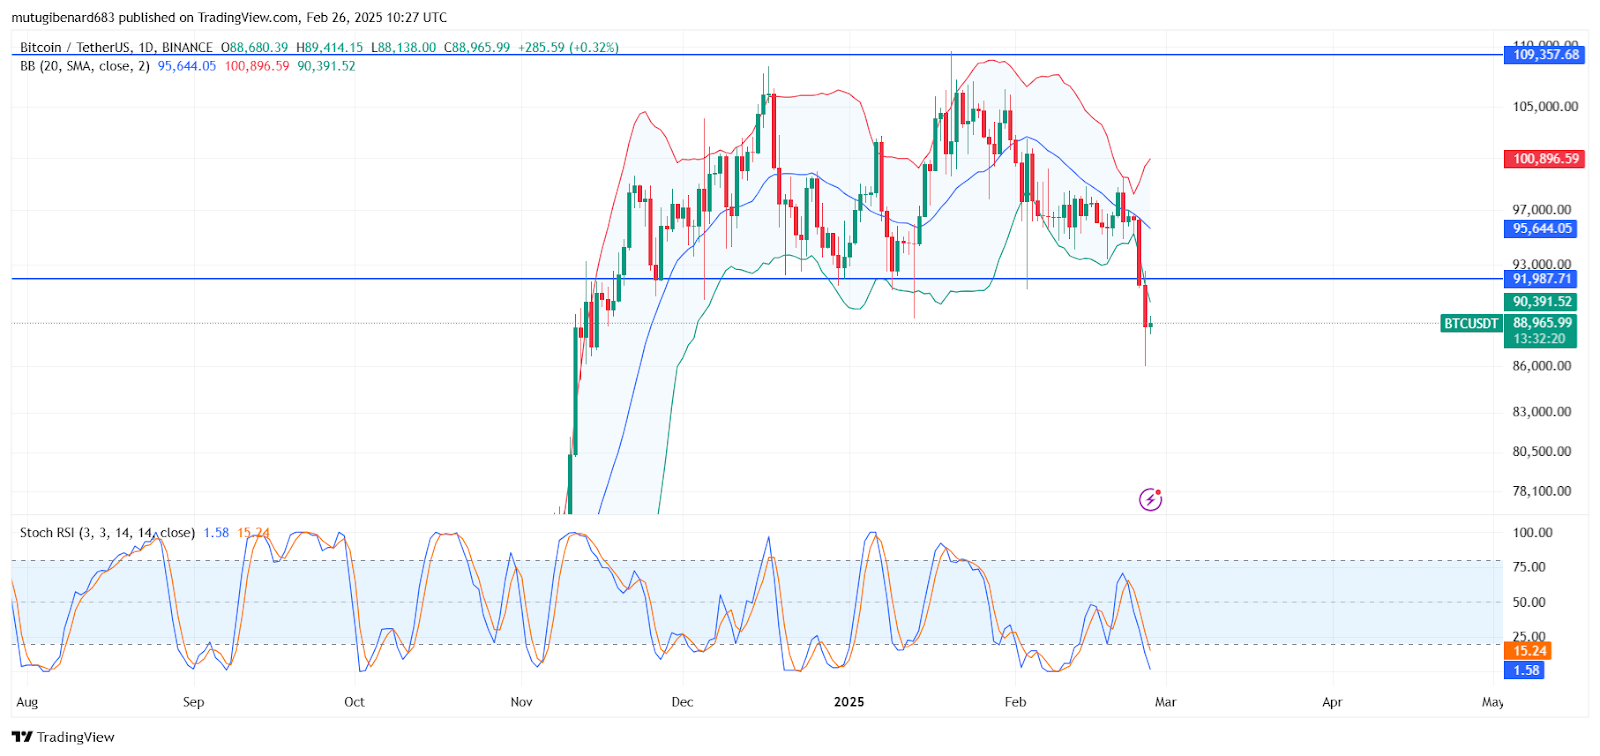
Stochastic RSI, which is currently at 1.74 (blue) and 15.29 (orange), indicates Bitcoin is in an oversold situation. This is traditionally followed by short-term relief in case of a change of momentum in favour of the purchasers. For a definite change, however, the Stochastic RSI must cross above 20 and go in an upward direction.
Possible Scenarios and Future Outlook
For traders, there is a conflicting set of signals in this current market. The short sellers can continue as long as Bitcoin is below $91,987. If selling is maintained, a new lower target is in the range of $80,000 – $82,000. The bulls have to see a Stochastic RSI crossover and re-taking of $91,987 before taking a long position.
While Bitcoin is under selling pressure, there is a possibility of a short-run bounce based on oversold levels. If there is buying interest, Bitcoin can test levels of $92,000, which can lead to a wider market bounce.
DISCLAIMER: The information on this website is provided as general market commentary and does not constitute investment advice. We encourage you to do your own research before investing.