
- Toncoin has been in a firm bearish trajectory, testing the support at the vicinity of $3.60–$3.70 with buyers awaiting cues of a price recovery.
- Technical analysis tools including RSI and MACD illustrate an oversold scenario that may prompt a short-term reversal if the major levels are regained.
- Breaking the resistance zone of $4.00 could trigger a rally and a failure to hold the support could push the price of TON downward.
Toncoin (TON) has been subject to selling pressures with the price consistently going lower. Market players are weighing whether the market will bounce back or if it will keep falling further. The major support areas are being tested and the world waits with anticipation of the next direction.
Will TON Recover or Extend Its Losses?
Veteran trader @mdtrade considers the price levels at the present a long-term buy opportunity. He suggests that Dollar Cost Averaging (DCA) may be the sagacious move since TON may be entering a reversal. Subject to the price crossing the $4.00 mark, a move to the zone of $4.50-$5.00 may be anticipated. Confirming the reversal of the trend will be RSI crossing 50, a boost in trading volume, and four consecutive four-hour candles with strength.
TON has been in a strong downtrend with lower highs and lower lows. The price has touched the support area of $3.60-$3.70 lately and has posted a small recovery, showing the availability of buyer demand. However, a breakout of the resistance area of $4.00-$4.20 with good volume will be the turning point of any recovery at all. Market sentiment and technical analysis will be the two factors that will drive the events next.
Technical Indicators Suggest a Turning Point
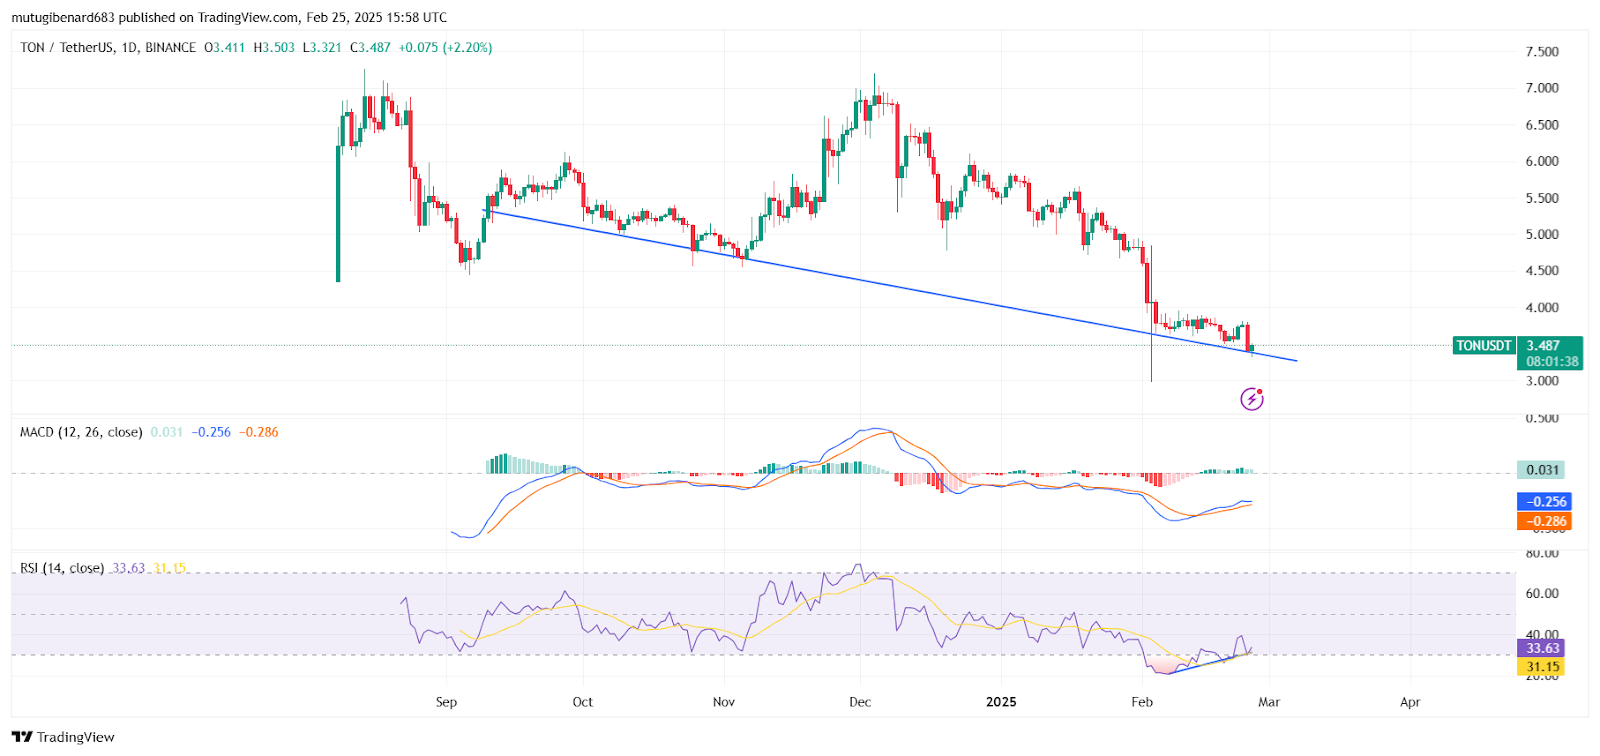
Relative Strength Index has dipped below 30 and has historically been followed with short-term relief rallies at such a juncture. RSI coming back above 40-50 may further support the argument of a reversal. The Moving Average Convergence Divergence maintains a bearish crossover with the MACD line (-0.41) lower than the signal line (-0.37). The MACD turning bullish may be a sign of renewed demand.
Dixon further states that RSI crossing beyond 50 will confirm bullish strength and a MACD change that turns positive will further confirm a reversal of the trend. The two confirming each other, the buyers will push the price of the TON upwards toward higher resistance areas. Otherwise, if the momentum fails, the bearish trend will dominate.
Key Support and Resistance Levels to Watch
TONCOIN has been in a clear downward trend with lower highs and lower lows defining the chart. The price has just touched the $3.60-$3.70 zone that had been short-term support. Failure to hold at this zone may push the price of TON toward the $3.30-$3.40 zone. In addition, a falling line has been the force behind the decline, and a recent dip through it suggests an additional selling force. Recovery may be the solution if the price regains the trend line.
If the support of TON fails, the price might continue falling and extend the bearish move. The buyers will be closely watching whether RSI fails to cross 40 and MACD fails to flip yet, signaling that the strength will continue. The price might fall lower with a clean fall through $3.60.
At the time of writing, Toncoin (TON) was priced at $3.43, reflecting a 4.35% decline in the last 24 hours and a 6.24% drop over the past week.
DISCLAIMER: The information on this website is provided as general market commentary and does not constitute investment advice. We encourage you to do your own research before investing.