
- Stellar (XLM) is consolidating in a symmetrical triangle, pointing to a potential 16% breakout in either direction.
- Support at $0.32100 and resistance at $0.34500 will determine if XLM is going toward $0.37 or falls toward $0.30.
- Stochastic RSI signals oversold conditions, suggesting a possible bullish reversal if momentum shifts in favor of buyers.
Stellar (XLM) is in a symmetrical triangle pattern with a 16% price movement. Everyone is closely observing the support as well as the resistance levels since these would be the guide for the next movement.
Symmetrical Triangle Signals Potential Breakout
Crypto analyst Ali Martinez tweeted the significant point that Stellar (XLM) is poised for a 16% price movement. Price is compressing inside converging trendlines, developing a symmetrical triangle. Symmetrical triangles tend to be broken, with the break direction dictated by market mood. A distinct break beyond significant levels will indicate the dominance of buyers or sellers.
Support is $0.32100, the lower level, and resistance is $0.34500. It can break upwards from the resistance level of $0.34500 and can reach $0.37 – $0.38, whereas a breakdown from the support level of $0.32100 can push XLM down toward $0.30 or even lower.
Fibonacci Levels and Market Structure
The analysis also uses Auto Fibonacci retracement levels, which point out essential support as well as resistance levels from the history of XLM. Current support level is the 0.618 Fibonacci level at $0.2903. A drop through the level can have the coin continue falling, with the next support level at $0.1959.
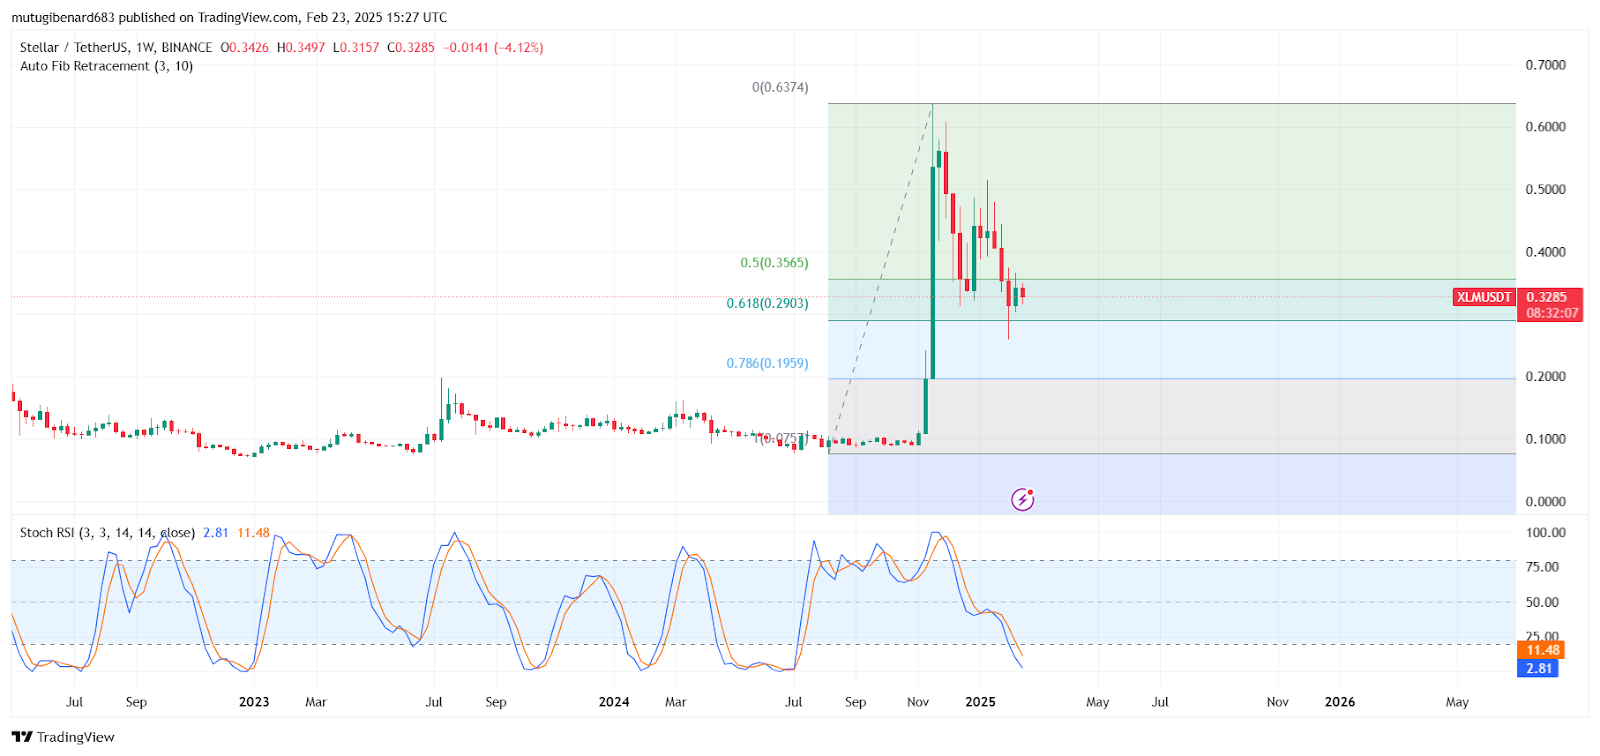
If XLM rallies back $0.3565 (0.5 level of the Fibonacci), there can be a push upwards towards $0.50 – $0.60. Sentiment in the market would be the factor in keeping the price above the levels of the retracement.
Momentum Indicators & Possible Scenarios
Stochastic RSI levels indicate being oversold at 2.78 (blue) and 11.47 (orange). Ali also indicated the possibility of a bullish reversal when the blue line crosses the orange line as the momentum changes.
If XLM maintains $0.2903 support, the traders can look for a potential uptrend. A loss of this level can have the coin continue the downtrend, considering the market’s ongoing weakness. Future trading sessions will be the defining factor in the next direction for Stellar.