

- Bitcoin is consolidating between $91,758 support and $109,357 resistance, with analysts anticipating a breakout toward $116,652.
- The Stochastic RSI is pointing to oversold conditions, and the DMI is revealing selling pressure reducing, hinting at a potential change in momentum.
- If Bitcoin breaks above $100,000, it could rally toward $116,652, with a further push bringing $165,745 into play.
Bitcoin’s price action continues. Current technical indications point toward the potential for a bullish break, with technical observers noting the occurrence of secret bullish divergence as the precursor for more bullish action.
Key Support and Resistance Levels
Crypto analyst JavonMarks tweeted yesterday that Bitcoin confirmed a secret bullish divergence pattern. In every past occasion when the pattern happened, there have been enormous price increases. Based on his analysis, the current target for Bitcoin is $116,652, representing a 20% increase. A break past the level would see Bitcoin rising as far as $165,745.
Bitcoin was trading between support at $91,758 and resistance at $109,357 at the time of writing. Prices have fluctuated in the zone, with investors watching closely for a breakout. A breakout above $100,000 would push the BTC towards the next resistance at $109,357 and above.
Moreover, market optimism is building on the capacity of Bitcoin to keep its run going. Previously, the same divergence confirmations have generated substantial rallies, backing expectations for the next run-up.
Momentum and Trend Analysis
Bitcoin’s price has been going upwards since the second half of 2024, with the more recent movement being sideways. Oversold levels have been signaled through the Stochastic RSI at 0.50 (the blue line) and 10.34 (the orange line), reflecting the chances of a bullish reversal as the buyers regain control.
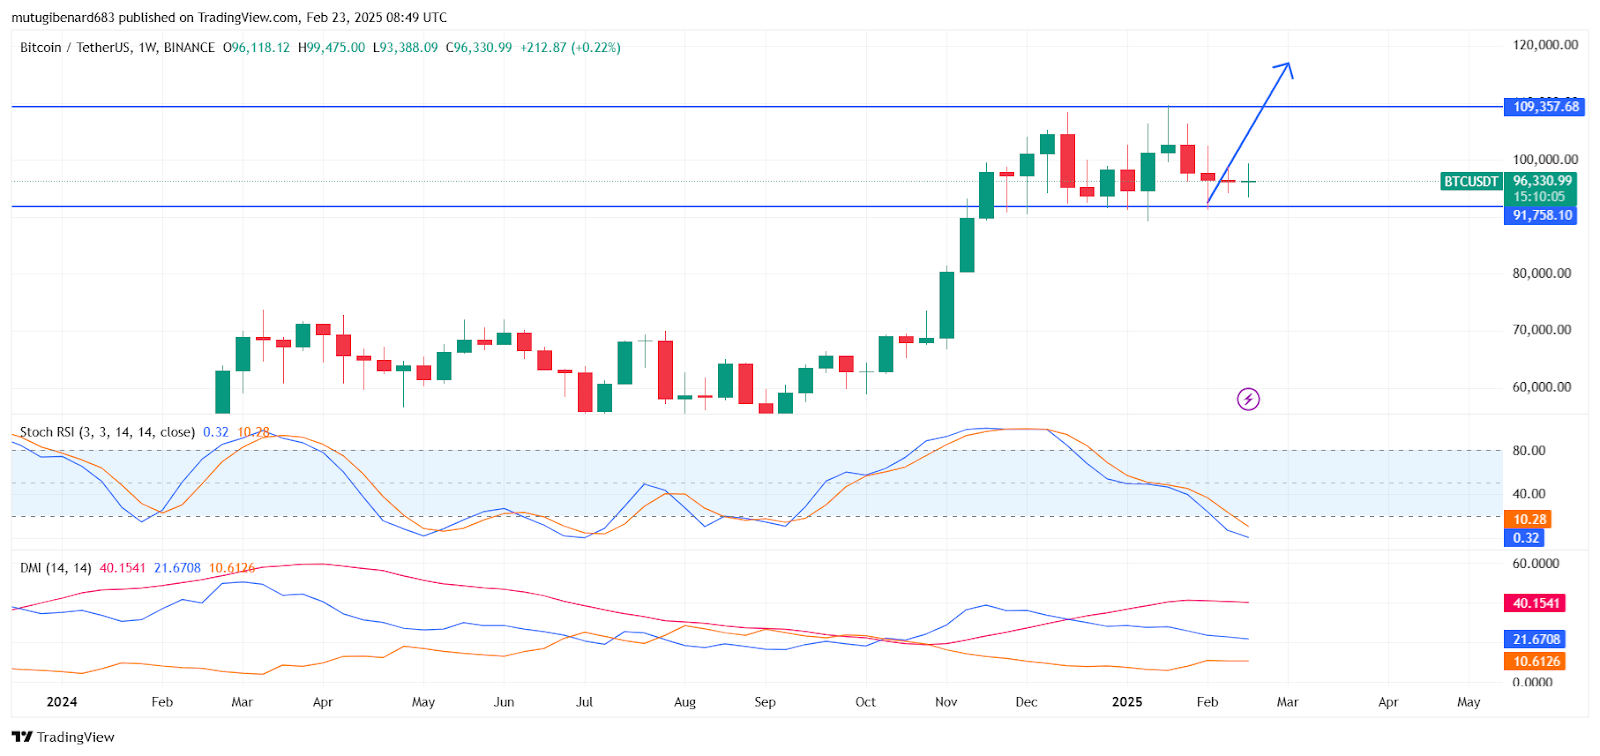
The Directional Movement Index is giving contradictory signals. Red line (40.15), the weak selling pressure measurement, is higher compared to the blue line (21.67), the weak buying pressure measurement. But the ADX at 10.61 is indicating the ongoing trend is lacking power, leaving the gates open for changes. If the bullish directional index (the blue line) rises higher, the bullish movement can be anticipated from Bitcoin.
Future Price Action and Market Outlook
If Bitcoin is supported at $91,758, the break upwards toward $109,357 is close at hand. If the coin is supported at $100,000, the coin can pursue a more bullish trajectory toward $116,652 in the days to come. Analysts also believe the break through the level can set the stage for the coin to approach $165,745.
However, a more significant correction can happen if the price drops below $91,758, possibly nullifying bullish patterns. Market players will keep observing the significant levels as well as the momentum indicators for the next significant movement. At press time, the price of Bitcoin was at about $96,455, with the players expecting the next movement in the days to come.