
- Kaspa is building an upward triangle pattern, and repeated tests at resistance at $0.11 are indicating the breakout could occur if the purchasing volume builds.
- A recent decline under an upward trendline signifies bear pressure, and the MACD foretells additional pressure to the downside and weaker support at $0.095.
- Current price action remains mixed, with traders monitoring key resistance and support levels to determine the next significant movement in Kaspa’s trend.
Kaspa (KAS) has exhibited mixed trends in the market, and market analysts are observing the possible major move. The cryptocurrency tests significant resistance and support, and the market could experience a breakout or a downward trend. The market analysts are monitoring the technical indicators and the market structure to decide the future trajectory.
Bullish Signals and Levels of Resistance
Crypto analyst Dark Horseman commented that Kaspa has been building an ascending triangle pattern, a bullish continuation pattern. The price has been making higher lows and testing resistance around the area of $0.11 numerous times. In case the buyers are able to push the price above this point at heavy volume, the breakout could push the price to $0.12, and possibly to $0.135.
Ali_charts also noted Kaspa’s anticipation of a possible 35% price shift. This follows the current structure in the price, indicating building momentum. The Stochastic RSI, moreover, has also been climbing, reflecting greater purchasing pressure. A breakout above the resistance at $0.11, confirmed, would support the above projections. Yet, if the resistance fails to be exceeded, the market could experience a brief pullback, the main support zones at $0.10 and $0.092.
Bearish Trendline Break and Market Weakness
Recent price action is worrying market participants. Kaspa broke the 4-hour chart’s upward trendline, suggesting possible weakness. A dominant red candle confirmed the breakdown, suggesting the trend could be losing energy.
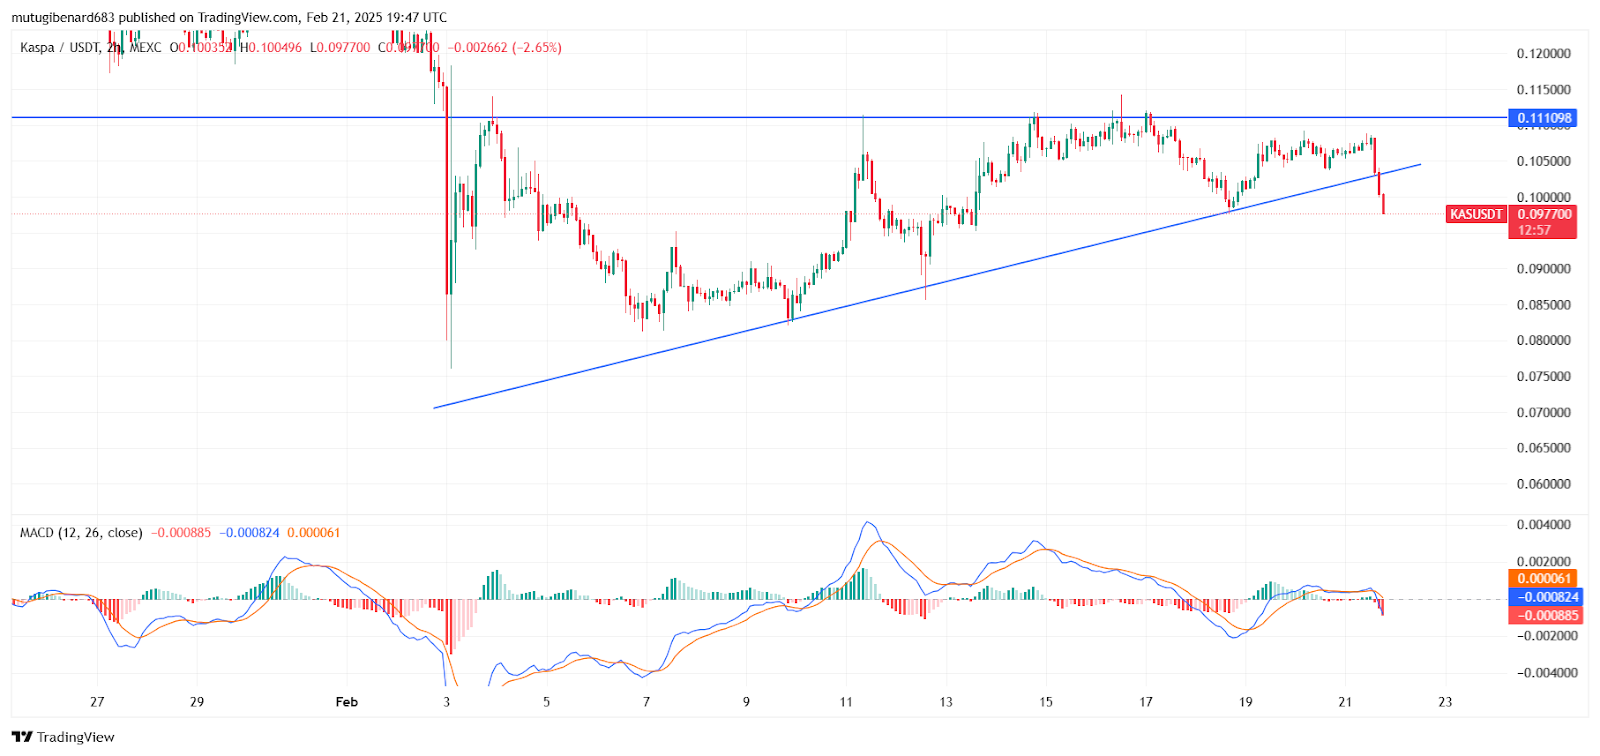
The MACD also showed a bearish crossover, and the histogram turned red. This shift indicates intensifying selling pressure. If Kaspa fails to recover the trendline, further downward movement may be expected, and support zones are at the levels of $0.095 and $0.090.
Dark Horseman noted while Kaspa already showed good previous price action, the current pullback deserves to be watched closely. The market players are watching if it could recover the lost ground or sustain the downward trend.
Current Market Trends and Key Levels
At press time, Kaspa was at $0.09973, reflecting a 5.99% decline in the past 24 hours and a 9.11% drop over the past week.
Ali’s analysis and Dark Horseman’s observations both highlight the importance of key resistance and support levels in the coming days.
DISCLAIMER: The information on this website is provided as general market commentary and does not constitute investment advice. We encourage you to do your own research before investing.