
- HBAR is testing major support at the area around $0.20–$0.22, the 20-week EMA, a significant point in the case of trend continuance.
- Resistance at 0.30 must be broken to the up side to initiate bullish pressure, and other targets at 0.45–0.50 and long-term at 0.80.
- A break under the support at $0.21 could extend the declines, and the significant support at $0.18 and $0.12 are closely watched.
Hedera Hashgraph (HBAR) is testing major support levels after a powerful upswing, and analysts are evaluating possible price directions. The cryptocurrency went through an extended period of bearish trend before the breakout in the later half of 2024. Now, while the currency consolidates, market participants are monitoring how the currency reacts to the EMA ribbons.

Retest of the EMA Ribbon and Key Levels
Crypto analyst Steph Is Crypto posted a tweet in which he noted the retesting by HBAR of the weekly EMA ribbons. The tweet implies the asset’s resistance at the support area between $0.20 and $0.22. This area also correlates to the 20-week EMA, which in the past has served as support in bullish trends. The asset’s resistance at the area, if the price holds above, could see the asset rebound to resistance at $0.30.
Beyond this near-term level, other resistance zones are at $0.45–$0.50, the area from which previous price activity encountered pressure from the sellers. A long-term objective at $0.80 also has been proposed in case the upward trend continues. A breakdown beneath the EMA ribbons, however, could result in a greater retracement to the area of psychological support at $0.16–$0.18.
Market Structure and Fibonacci Retracements
HBAR’s price follows the lines of the Fibonacci retracement levels, the places where support and resistance are most likely to occur. The 0.5 point, around $0.2215, is under test. A hold at this juncture could see the price advance to the 0.382 at $0.2639 and the 0.236 at $0.3164. A steady advance could see the price advance to previous highs.
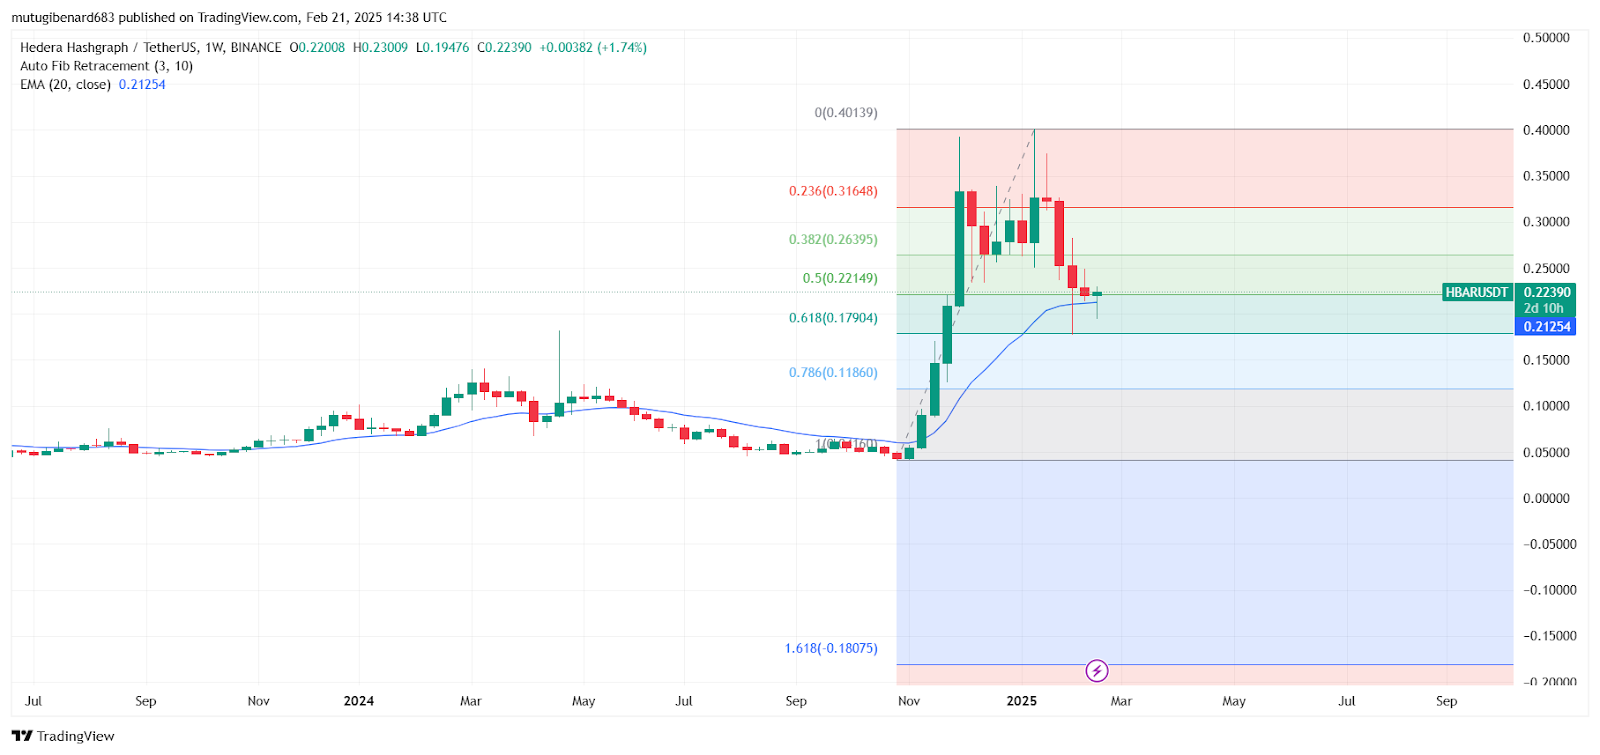
In contrast, if support collapses in HBAR, the other major support to look at is the 0.618 Fibonacci at the level of $0.1790. A breakdown from there could see the prices going to $0.1186, a total retracement of the last move.
Potential Scenarios for HBAR’s Price Movement
A successful bounce off the EMA ribbons would confirm bullish continuation, and confirmation in the case of a breakout above the $0.30. Higher market activity in the market shall support the trend. A weekly close below the $0.21 could usher in further pressure, and support at the levels of $0.18 and $0.12. The market’s future direction at these levels is closely monitored by the market participants.