
- Jupiter (JUP) is getting closer to the historically robust support of $0.69 that has triggered rebounds, attracting traders interested in tracking accumulation opportunities.
- The Bollinger Bands are showing that the stock is at its lower border, with possible oversold levels that could initiate a short-run bounce back.
- Stochastic RSI readings indicate oversold market conditions, increasing the probability of a potential bullish reversal if buying pressure strengthens.
Jupiter (JUP) is about to approach a key support area of $0.69 that had served to support price rallies in the past. The coin was at a price of $0.7457 at the time of writing with a 3.89% gain over the last 24 hours. Traders are patiently waiting at this price to look out for a potential bounce back.
Price Action & Levels of Market Support
A prominent Crypto analyst Ali_charts pointed out that JUP is approaching a crucial support zone between $0.69 and $0.75. This area has consistently demonstrated strong buying interest, preventing further declines on multiple occasions.
Historically, JUP recovered out of this range, which means that the traders consider this a strong accumulation area. If the price remains above $0.69, a trend to higher levels can be anticipated. Yet a break below this could result in a continuation of the decline with the next support at $0.60.
Technical Indicators and Market Sentiment
The Bollinger Bands signal that the price of JUP is at its lower border at about $0.6939. It is a sign that the asset is likely to be oversold, a state that has also triggered price rallies earlier. The middle band is at about $0.8562, serving as a dynamic resistance, while the highest is at $1.0086.
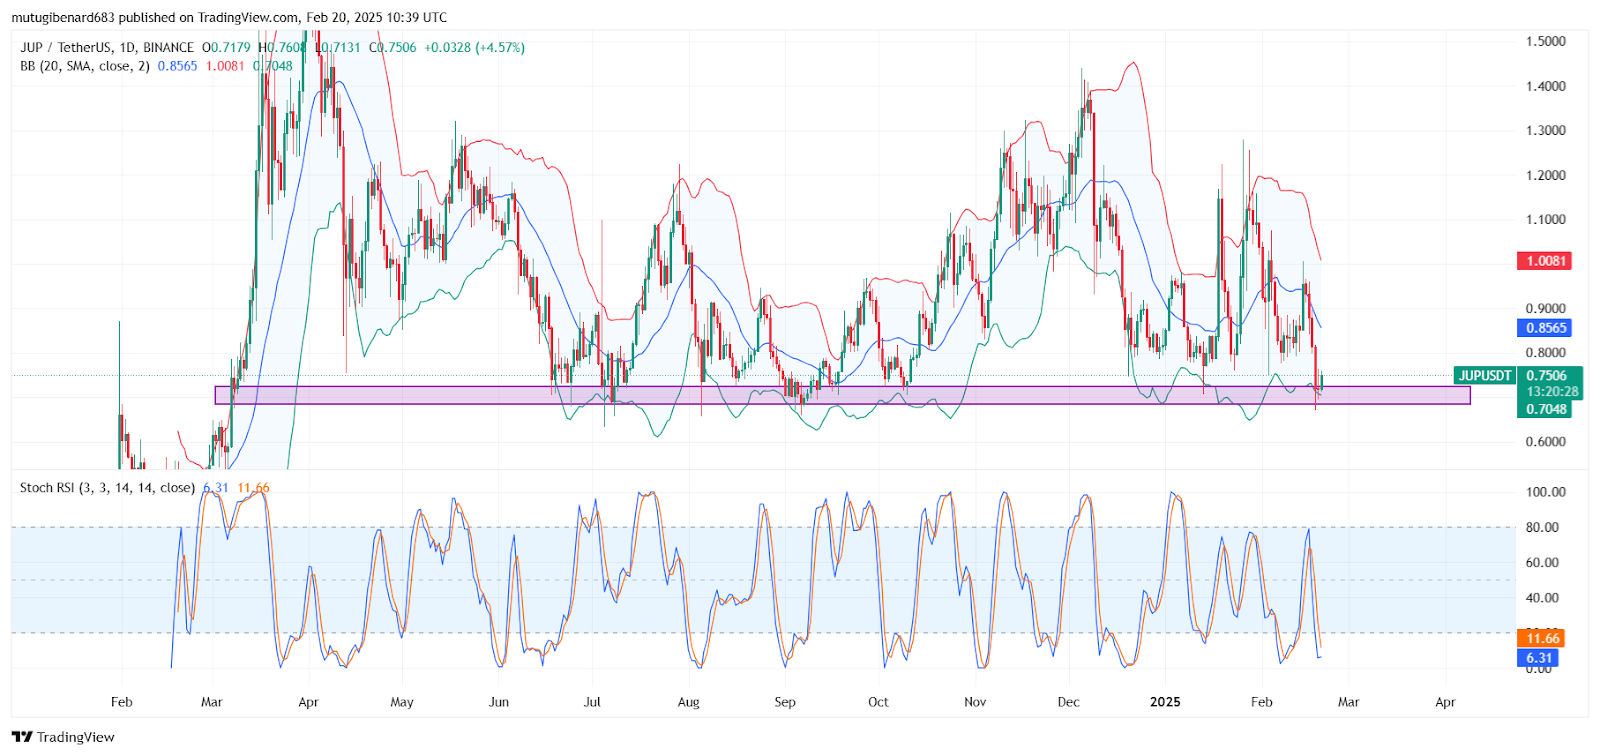
Additionally, the Stochastic RSI is extremely low with the orange line at 5.41 and the blue line at 11.36. These are oversold levels that enhance the possibilities of a bullish turn if the pressure to buy grows.
Potential Price Scenarios of JUP
A bullish outcome might occur if the current support range is penetrated by the buyers, possibly sending JUP to the middle Bollinger Band at $0.85. If the trend persists, a break out of the $0.86–$0.90 resistance area might signal a trend to the upside.
On the downside, a decline to below $0.69 would aim at the support levels of around $0.60. However, with the oversold Stochastic RSI and the price at the lower levels of the Bollinger Band, the possibilities of a sudden decline at the current time are less likely unless overall market sentiment worsens.
Jupiter’s price action is at a crossroads with traders awaiting confirmation of the next direction of travel.
DISCLAIMER: The information on this website is provided as general market commentary and does not constitute investment advice. We encourage you to do your own research before investing.