
- HIGH trades in an uptrend channel, wherein the support level lies between $0.70 and $1.20, showing signs of possible accumulation and revival.
- The MACD bar indicates waning bearish pressure, while Bollinger Bands show heightened volatility, validating the possibility of an impending break.
- A break over $1.20 has the possibility of driving HIGH to $1.50, while failure to break over it may lead to fresh selling pressure.
Highstreet (HIGH) has also been going upwards in an inclined channel, showing that an impending breakout may soon happen. Current trends reveal possible buying, while technical indicators signal a momentum shift.
Key Support Level and Market Structure
Crypto analyst Alpha Crypto Signal, on X, noted that HIGH has also been trending upwards in an ascending channel. The downtrend has driven the price down to a crucial support level between $0.70 and $1.20, an area previously witnessed with historical demand.
Recent price action shows buying near the bottom of this support level. Price has rallied back from here, indicating buyers may be stepping in. A break over near term resistance level $1.20, however, must occur to confirm a change toward an upside trend.
Bollinger Bands and MACD indicate possible change.
The Bollinger Bands depict volatile fluctuations. Price has touched the support line, showing it has oversold, and has experienced a subsequent revival. The middle line (20-day SMA) at $1.00 serves as support, and any break above it may give further momentum to the bulls.
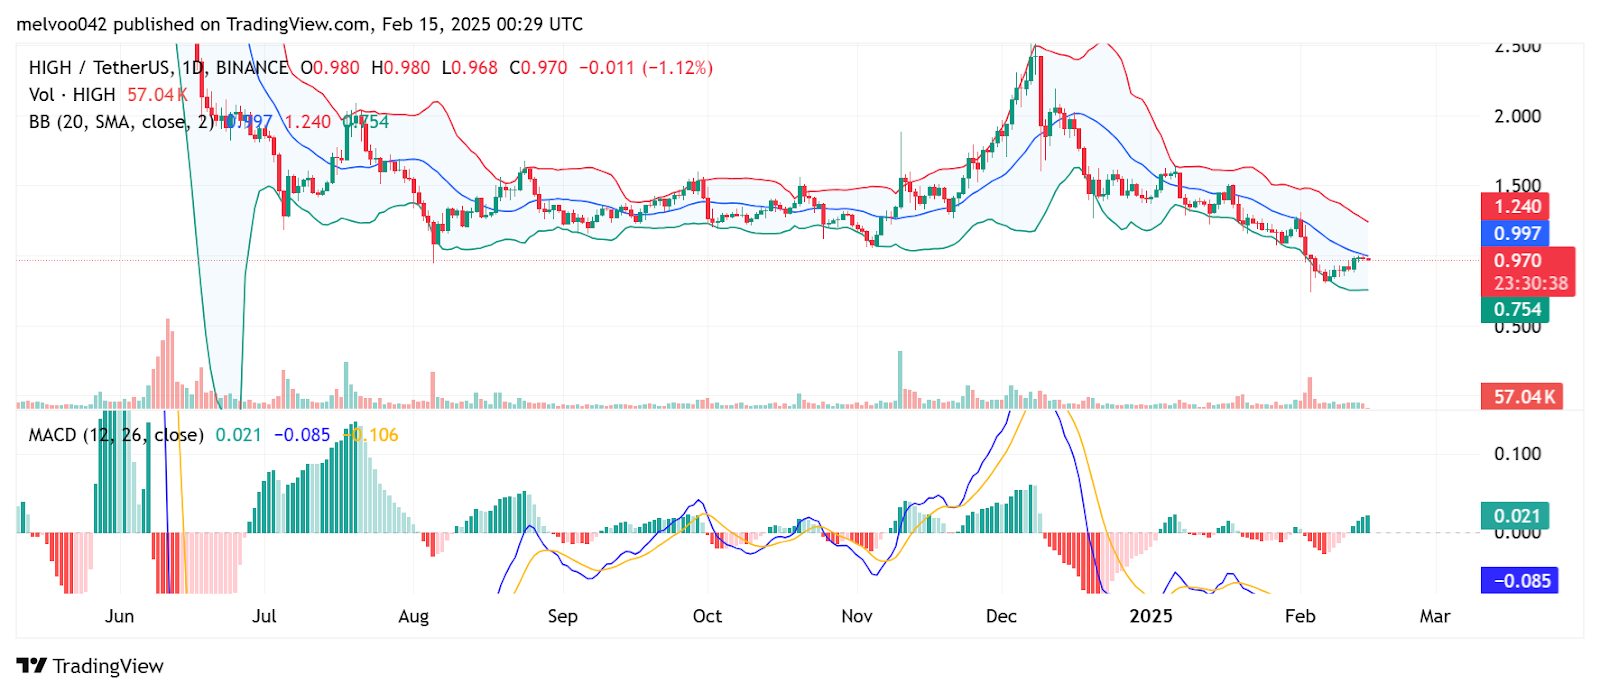
The MACD indicator also reflects a bearish momentum decline. The MACD histogram has turned from darker red to lighter red and green, indicating less force of selling. The MACD line also remains below the Signal line, but the crossover would validate the possible change in the trend.
Potential Price Levels for HIGH
If HIGH remains supported between $0.70–$1.00 and crosses $1.20, it could move toward $1.50 or further. A bullish crossover by the MACD, together with the price going over the middle line of the Bollinger Bands, would also support this scenario.
Conversely, failure to break over $1.00–$1.20 support could lead to fresh selling. A drop below $0.70 could send it down toward further lows.
At press time, it had an exchange rate of $0.9831, while the 24-hour trade volume stood at $14.98 million. The price has risen by 0.69% over the last 24 hours, while it has risen by 17.43% over the last seven days.
DISCLAIMER: The information on this website is provided as general market commentary and does not constitute investment advice. We encourage you to do your own research before investing.