
- The LINK token enjoys strong support levels between $17.50–$18.50 which holds back its price from falling lower and keeps it prepared for an upward price trend.
- LINK could rise toward the $25.83 resistance because the Bollinger Bands show the market has become oversold and a breakout over $20.85 could trigger this rally.
- LINK could advance to $21 or reach $23 based on the bullish signal from the Stochastic RSI that indicates buying pressure is increasing.
Chainlink (LINK) is also showing a potential bounce, with technical indicators suggesting a potential up move. The price has been range-bound in a crucial support area, and there is a chance of a breakout signaled by bullish indicators.

Strong Support Level Providing Stability
A crucial support at $17.50 to $18.50 has consistently held up, preventing LINK from going lower. The range has been constantly tested, with buyers coming in to support the price. If this price level continues to be a strong support, LINK can push towards the next resistance of $20.85.
Crypto analyst Ali noticed that TD Sequential indicator is flashing a buying signal around this support, increasing the possibilities of a price bounce. If LINK remains above this range, a move to $21 or even $23 is likely in the short term.
Bollinger Bands indicate price stabilization
Chainlink is trading near the lower Bollinger Band, suggesting that it is in an oversold condition. Historically, such a condition has led to price appreciation owing to buying demand. Breaking above the middle Bollinger Band of $20.85 would signal bullish sentiment, possibly pushing LINK to the upper band of $25.83.
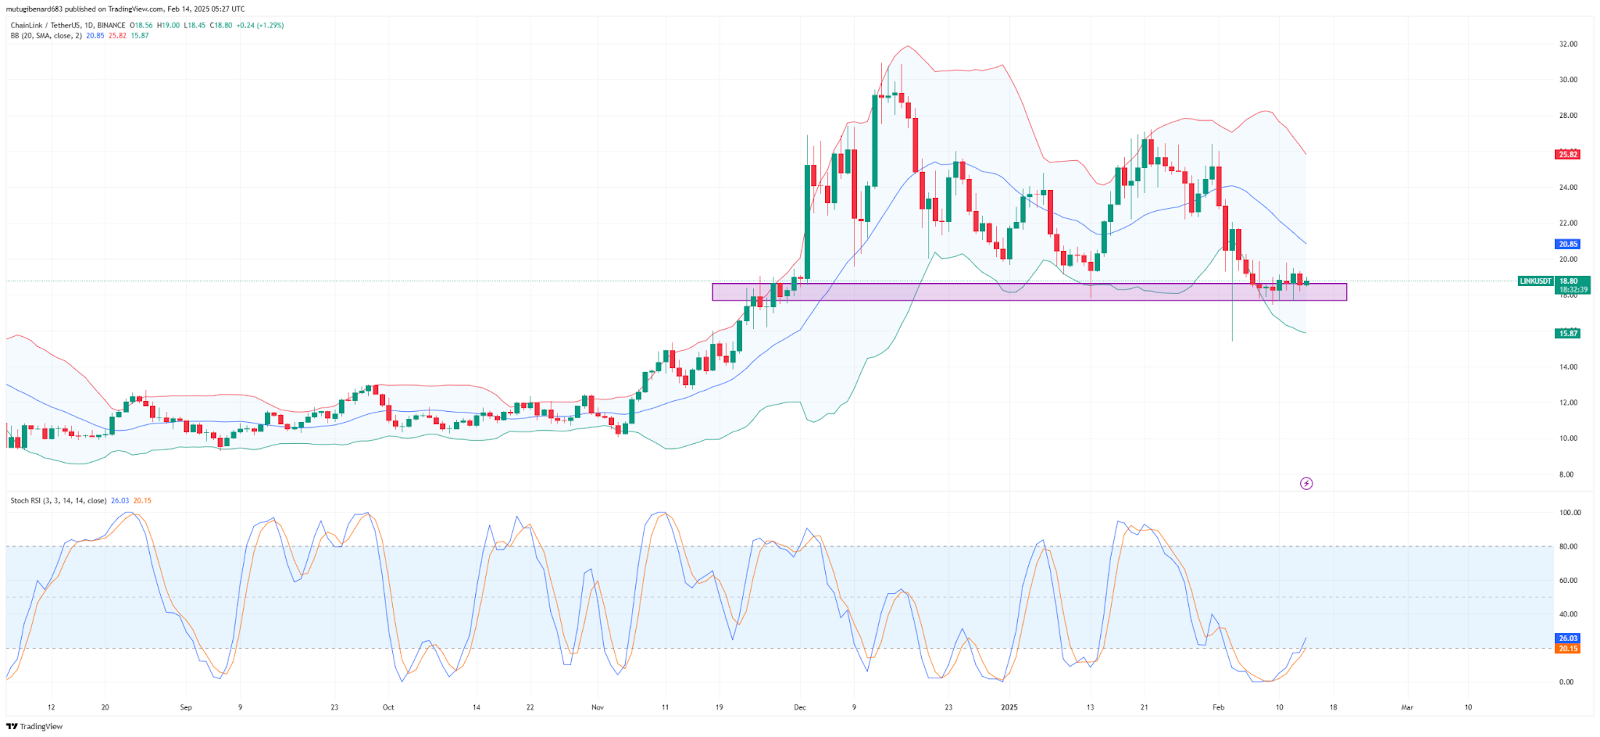
The failure to maintain support at $18.00 would trigger a probable decline toward the next support position at $15.87. The move would signal intensified selling activity together with future market weakness during short-term market periods.
Stochastic RSI indicates a possible reversal
The Stochastic RSI, a momentum indicator, is moving up from oversold levels. The blue line is at 25.54, and the orange line is at 19.99, indicating a bullish cross. Such a move tends to signal increasing buying interest, which would result in a price bounce.
Potential scenarios start from a breakout over $20.85, possibly to a test of $25.83. In the event that LINK can hold up over $26, the rally can move to $30 or more. Alternatively, if LINK breaks below $17.50, the price is likely to move to $15.87, posing more downside threats.
At press time, LINK was at $18.77, having fallen by 1.06% in the last 24 hours.