
- APT’s TD Sequential buy signal hints at a reversal, but it must break $6.80-$7 for confirmation, with targets at $7.50-$9.00.
- The RSI recovery to 36.76 suggests weakening bearish pressure, while the MACD crossover hints at potential bullish momentum.
- APT must hold above $6.25 to sustain its uptrend; failure risks a drop to key support at $5.50-$5, extending the downtrend.
Aptos (APT) has been struggling in a persistent downtrend, but fresh technical signals suggest a potential turnaround. According to analyst Ali, the TD Sequential indicator has flashed a buy signal on the weekly timeframe, hinting at an exhaustion of the recent sell off.
At press time, APT was trading at $6.2543, gaining by 6.02% over the past week, which adds weight to the bullish outlook. However, confirmation is important as the asset trades near crucial price levels.
The movement indicates that buyers have stepped in after APT hit a weekly low of around $5.66. This upward momentum is crucial as Aptos approaches key resistance areas that could define its next trend. The price pattern suggests a shift, but breaking above resistance will be essential for sustained growth.
Key Support and Resistance Levels to Watch
The market pattern shows major support and resistance levels that could influence APT’s next move. Immediate support is at $5.70-$5.90, which previously was a strong accumulation zone. A deeper decline could push APT toward $5-$4.50, a new support area.
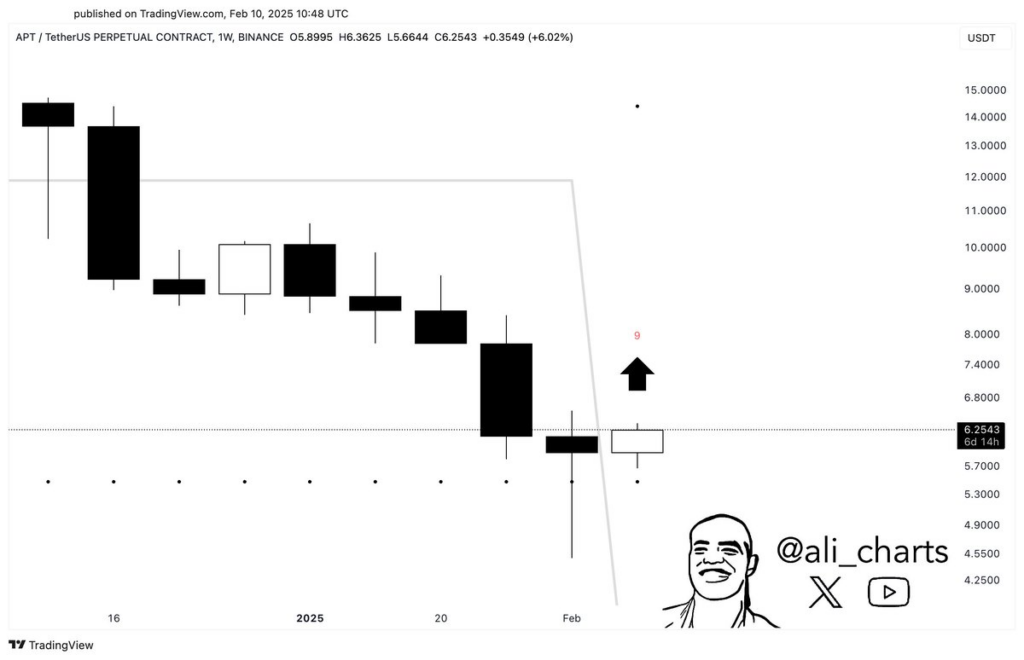
On the upside, APT has its first resistance between $6.80 and $7.00. A successful break above this zone could lead to a rally toward $7.50-$8, strengthening the case for a broader recovery. If buying pressure persists, APT may target $8.50-$9, a potential trend confirmation.
Short term momentum will depend on whether APT can establish support above $6.25 and reclaim higher resistance levels. The TD Sequential buy signal provides a bullish outlook, but sustained price movement is required for a reversal.
Technical Indicators Show Mixed Sentiment
Some technical indicators suggest a weakening bearish momentum while others call for caution. The RSI is at 36.76, recovering from an earlier low of 32.06, an improvement in buying interest.
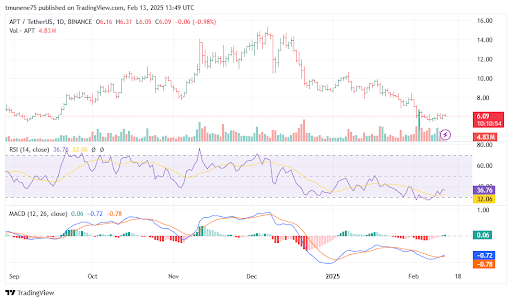
However, it remains below the neutral 50 level, indicating weak overall momentum.The MACD histogram is negative at -0.78, though the MACD line has started crossing above the signal line.
This hints at a potential momentum change, but stronger bullish confirmation is necessary before a definitive trend change can be confirmed. If it holds above $6 and pushes past $6.50, a test of $7 could follow.
However, failure to sustain these levels may lead to another downturn, with $5.50-$5 becoming the next important support zone. Next price levels will be essential in determining whether APT can sustain its recovery or if further downside risks persist.
DISCLAIMER: The information on this website is provided as general market commentary and does not constitute investment advice. We encourage you to do your own research before investing.