
- UNI is trading close to key $8.88 support, which has historically halted declines and could provide a buying opportunity for traders.
- The Stochastic RSI is oversold, indicating a potential reversal of price if bullish momentum gains strength in the next few sessions.
- A decline of UNI below $8.88 will expose the lower demand area from $4.00-$4.50 but maintaining support might trigger a surge towards $10.00-$12.00.
The current price position of Uniswap (UNI) stands near fundamental support which indicates either an upward movement or a downward trend possibility. UNI shows market signs that it is approaching a critical juncture which makes this token a key watch in upcoming days.
UNI Price Action and Key Support Levels
Crypto analyst Alpha Crypto Signal points out that UNI recently broke down from a descending triangle pattern and is currently fluctuating around its lower horizontal support level. Priced at $9.64 at the time of writing, UNI is currently trading above the $8.88 support, which has in the past served as a solid price floor. If this support holds, it may allow for a recovery to the $10.00 – $12.00 resistance zone. Failure to hold above support, however, may send the price to $8.00, a level that analysts see as a strong buying opportunity.
Additional downside action would have UNI probing the $4.00 – $4.50 demand zone, which in the past acted as a strong support base in 2022. Investors are watching closely at these levels since they will dictate the subsequent price direction.
MACD and Stochastic RSI Show Oversold Conditions
Market indicators are sending mixed signals for UNI’s future direction. The MACD line remains below the signal line at -0.527 vs. 0.616, echoing ongoing bearish momentum. The declining MACD histogram also portrays weakening market momentum, but a bullish crossover may reverse sentiment.

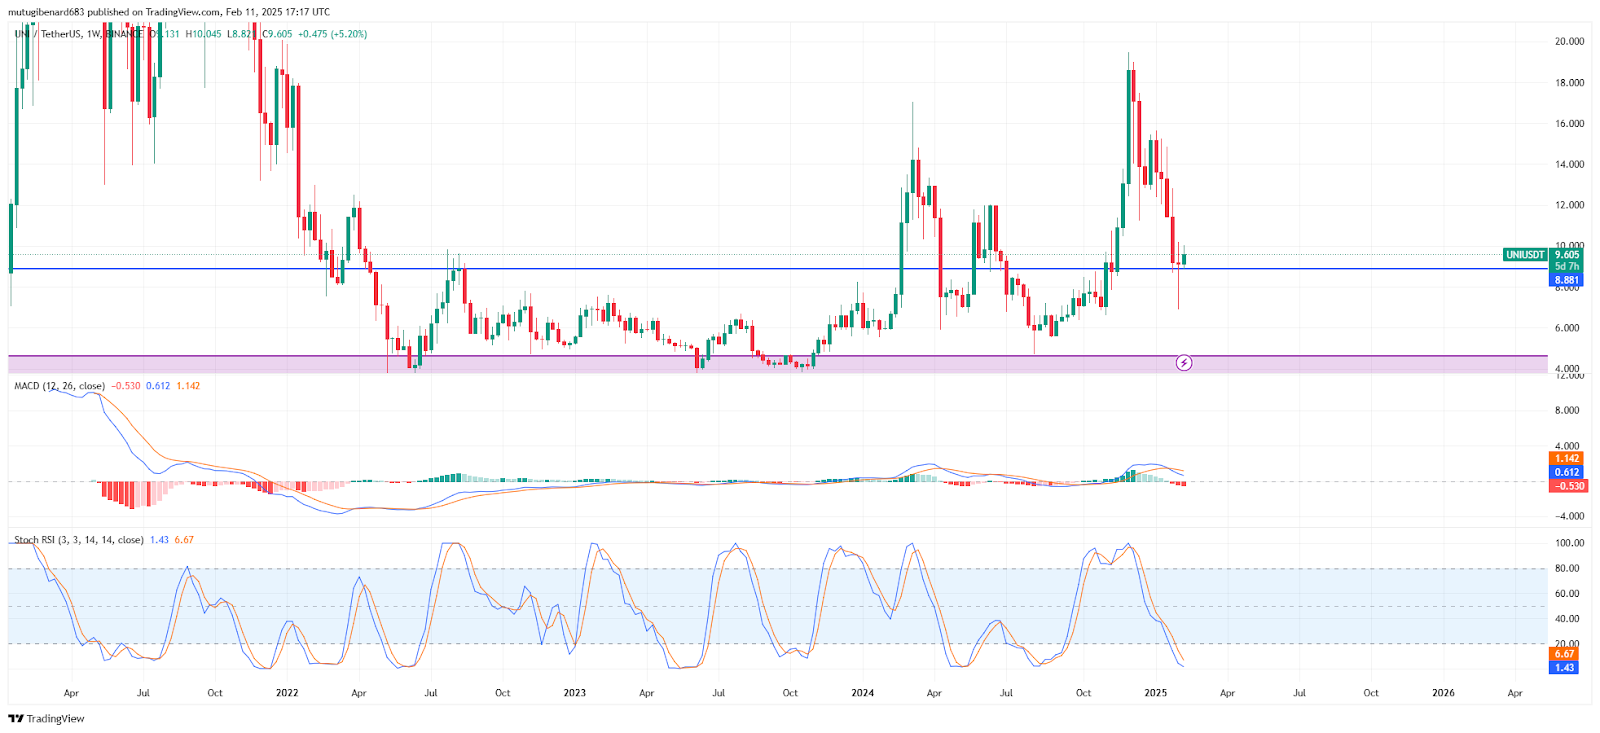
The Stochastic RSI is %K: 1.56 and %D: 6.71, indicating UNI is oversold. Such oversold levels have in the past been preceded by price recoveries, and a bounce can occur if buying pressure is resumed. A bullish crossover in the Stochastic RSI would validate a trend reversal to the upside.
Possible Scenarios for UNI’s Price Movement
UNI’s price action indicates two scenarios. On the bullish side, holding above $8.88 support might push the price back to $10.00 – $12.00. A breakout above this level would most likely carry gains to $16.00 or more. Confirmation of a Stochastic RSI crossover and a MACD bullish reversal would also support this view.
Alternatively, if UNI fails to hold above $8.88, it can fall towards the $4.00 – $4.50 demand zone. This zone has historically had strong buying pressure and may be a long-term accumulation area.