
- ZIL’s rounding bottom pattern signals accumulation, hinting at a possible bullish breakout above key resistance levels.
- A breakout above $0.23-$0.25 could trigger a 1,400% surge, with Fibonacci extensions suggesting potential upside targets.
- ZIL is testing a key trendline as support—holding above it may fuel gains, while failure could lead to lower Fibonacci retracements.
Zilliqa (ZIL) looks poised for a bullish breakout. The currency is in an extended consolidation period with recent price movements validating the recent shakeout stage. Analysts foresee over a 1,400% price recovery to the $0.23 – $0.25 range. ZIL now trades at $0.01212, lower than anticipated levels. A rounding bottom pattern signals an accumulation stage before a sustained uptrend.
Potential Breakout from Key Levels
Besides the accumulation, technical indicators suggest a shift in momentum. The prolonged downtrend follows stability. A crucial resistance zone between $0.23 and $0.25 aligns with previous market tops. If buying pressure increases, the price may begin a strong recovery.
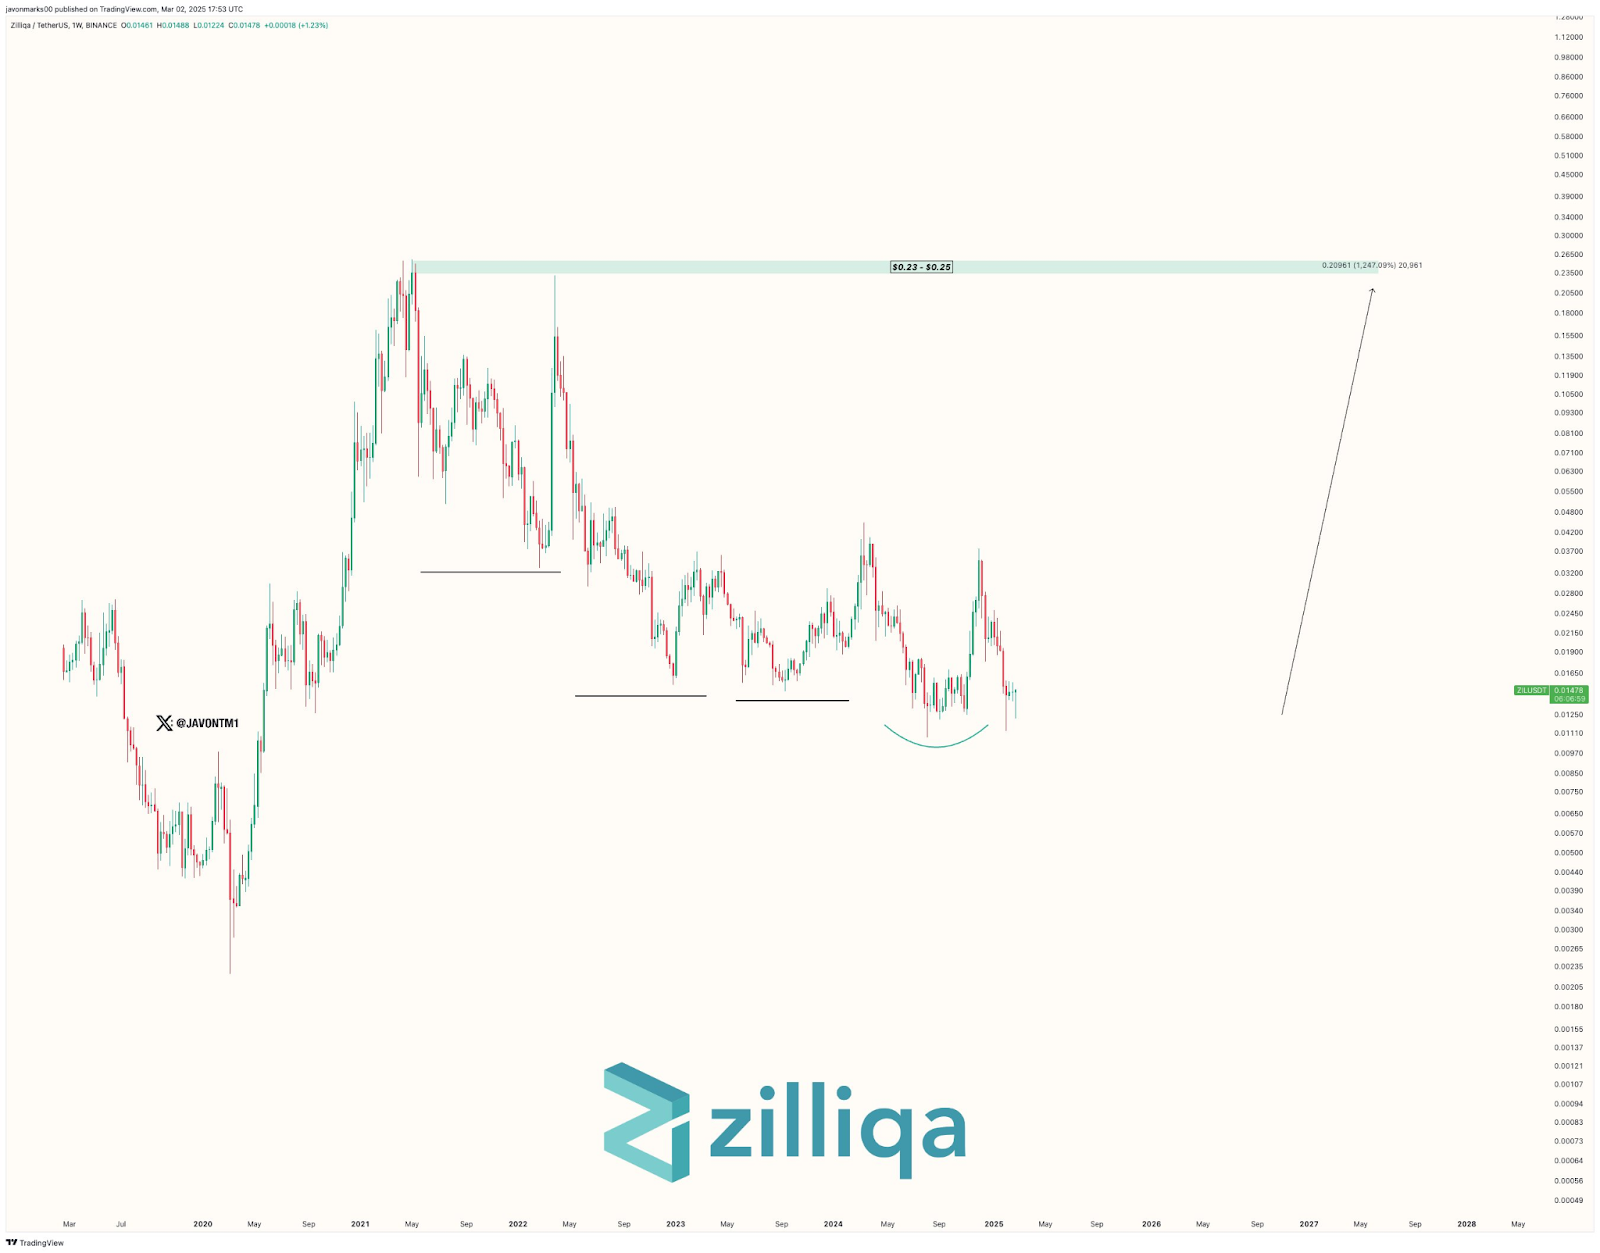
Additionally, historical price movement shows ZIL’s ability to rally significantly after prolonged accumulation phases. Past trends suggest that breaking resistance levels could result in exponential growth. Hence, market sentiment and volume influx will play a critical role in determining the breakout’s success.
Retesting the Descending Trendline
Meanwhile, a separate analysis highlights ZIL’s current price of $0.01391, reflecting a minor decline of 1.35%. The 4-hour Binance chart suggests a breakout retest at a key descending trendline. Fibonacci retracement levels show crucial support at $0.01294 and $0.01347. The lowest point, $0.01124, serves as a major support level.
Consequently, the price has busted the downtrendline and is testing it now as a support level. If this is the situation, ZIL could be looking for Fibonacci extensions at $0.01570, $0.018, and $0.02292. Being unable to sustain above this trendline, however, might force a retest of lower Fibonacci levels.
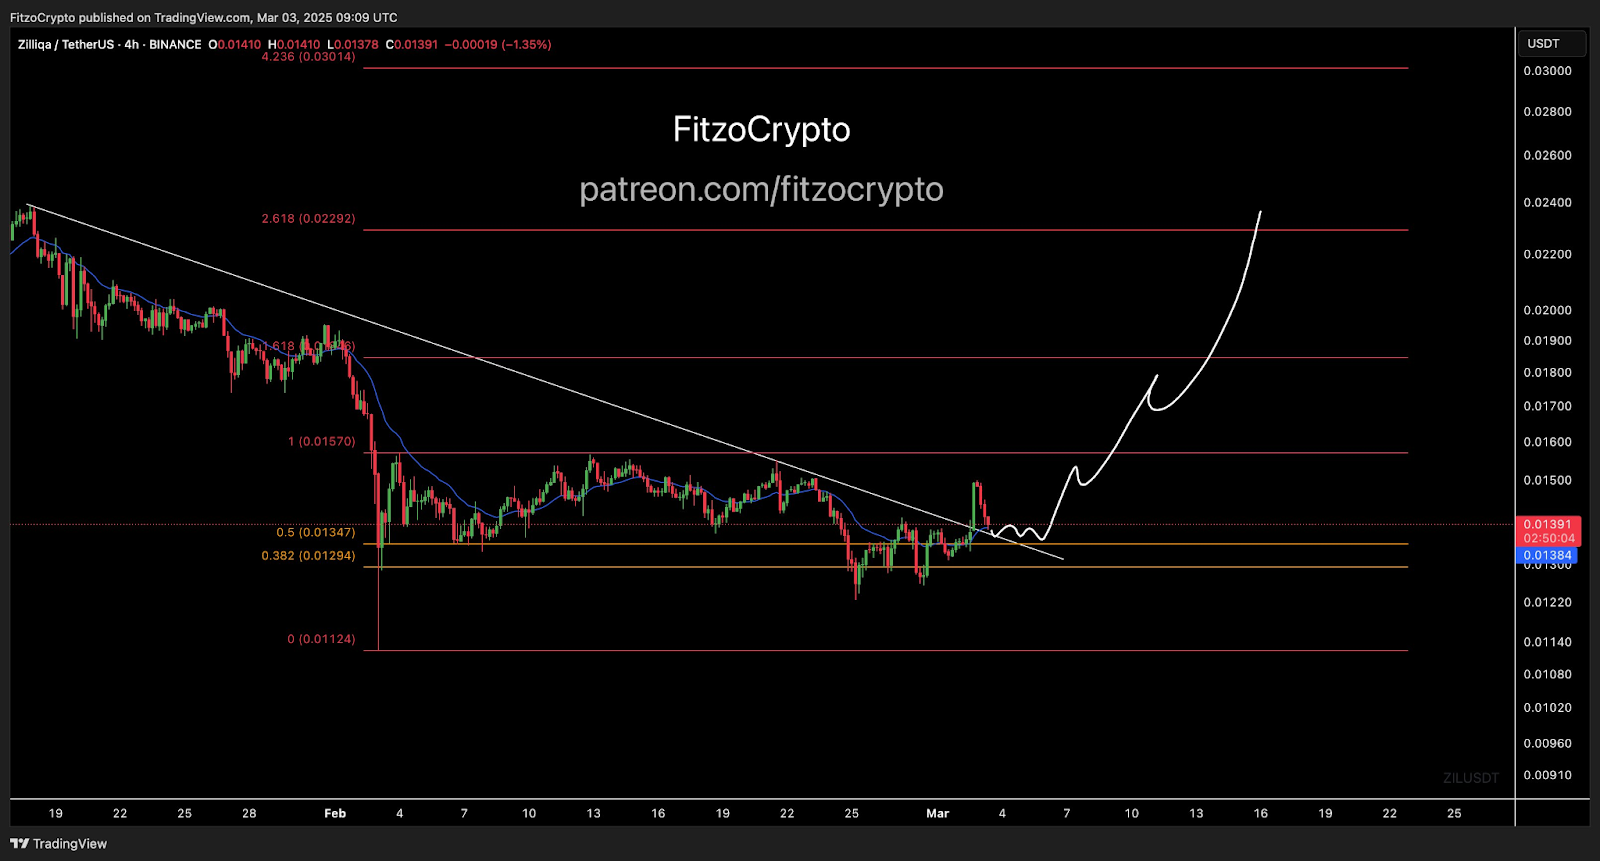
Furthermore, moving averages indicate continued consolidation before a breakout. The price has formed a base after prolonged declines, setting the stage for a potential bullish reversal. Although volume data remains absent, the chart structure suggests accumulation. Traders should watch support levels closely to confirm upward movement.