
- A bullish divergence on both RSI and MACD is also very rare in ZIL, which can indicate an end to the trend at multi-year lows.
- Price trades between the range of $0.01045 support and $0.01073 resistance with strong base formation but low volatility.
- A breakout above resistance may initiate a technical rally with a 260% to 300% upside target to the $0.044 sector.
Zilliqa (ZIL) continues to exhibit a rare technical formation, drawing attention from price action analysts. The token, now priced at $0.01067, is showing a sustained bullish divergence. This formation is not only visible on the Relative Strength Index (RSI) but also reflected on the MACD indicator.
Both tools highlight a potential for a notable upward shift, as the current divergence spans several months. The pattern is reinforced by multiple price rejections from the $0.01045 support zone, further solidifying its technical relevance. This consistent behavior may hint at a maturing setup, while price continues to hover between the $0.01045 and $0.01073 range.
ZIL Eyes Breakout as Bullish Divergence Builds
The descending trendline in the chart has been hit at least four times by the price of ZIL, with a low on the RSI each time being linked to a higher low. This structure is also evidenced by the MACD illustrating comparable divergence with further verification.
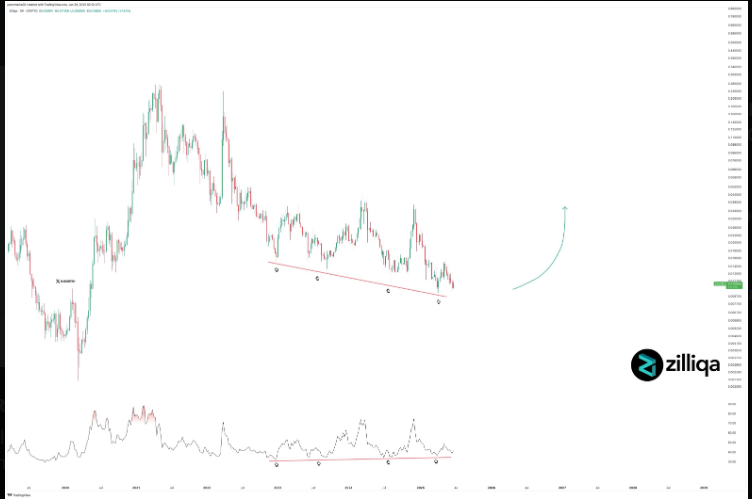
Source:(X)
These technical patterns often precede large moves, especially after prolonged downtrends. Price action remains compressed but steady, maintaining above the $0.01045 mark. The resistance level near $0.01073 continues to reject upward movement, creating a narrow band of volatility in the short term. Despite this, indicators have not yet invalidated the bullish divergence.

Support Remains Unbroken Despite Repeated Tests
The $0.01045 support zone has absorbed repeated downside pressure, which has been key in preserving structure. Price repeatedly tests this base without triggering breakdowns, a sign of resilience within current market conditions. Buyers have consistently defended this level since early 2024. The price remains just 0.3% above support at $0.01067, while also trading 0.3% below the overhead resistance of $0.01073. This narrowing structure is often a precursor to strong volatility expansion in either direction.
Breakout Projection Sees Possible 260% to 300% Upside
If the divergence resolves to the upside, a technical rally may unfold with targets toward the $0.044 range. This would represent a price gain of 260% to 300% from current levels. While the trigger for such movement remains uncertain, the chart setup shows historical structure that often precedes such spikes. The market continues to hold within the critical range, while momentum indicators point toward a building pressure phase. Any breakout would need to surpass $0.01073 convincingly to confirm directional momentum.