
- ZEC tested a crucial two-level breakout after reclaiming liquidity zones, showing renewed buying strength around the mid-470 support region.
- XVGT displayed a multi-year wave pattern with projected corrective and recovery phases, outlining a long-term structural roadmap across several market cycles.
- The broader crypto market posted sharp swings between 7 and 12 billion dollars, forming rapid drops and quick rebounds during the weekly volatility.
ZEC bulls opened the week with renewed attention as several charts shared online pointed to shifting momentum across multiple crypto markets. Trading activity reflected changing sentiment.
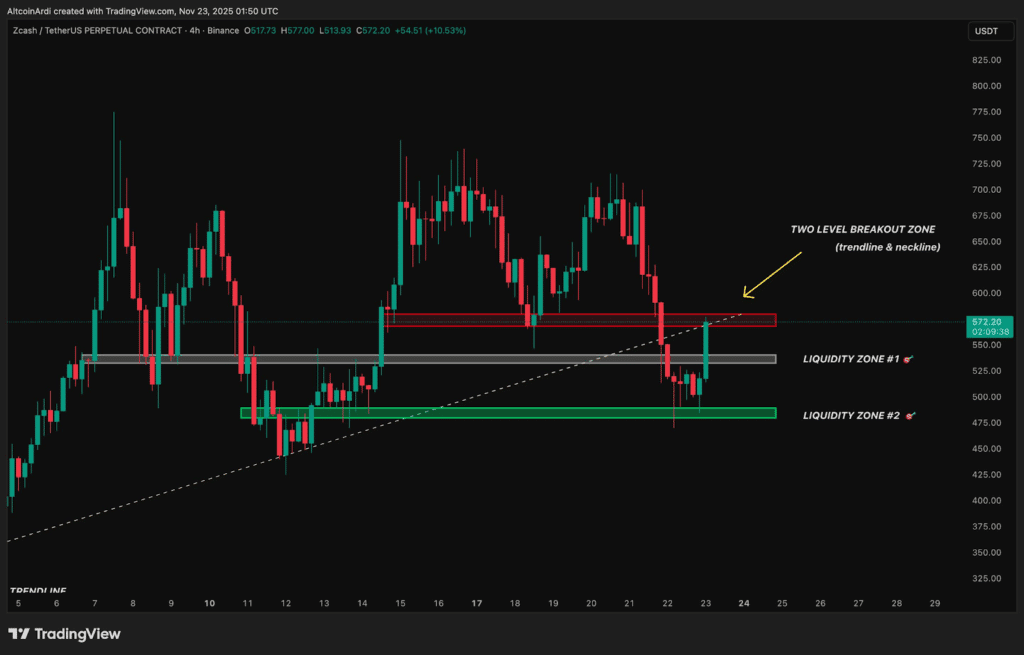
ZEC Price Attempts Multi-Level Breakout
ZEC bulls attempted to push price through a two-level breakout around the 565 area. The post referred to a 4-hour ZEC/USDT structure that recently reclaimed two liquidity pockets after a deep sweep of lower demand.
The chart showed price recovering after moving through an ascending trendline and reaching Liquidity Zone #2 in the mid-470s. Strong buying interest emerged in that region, with a rebound carrying price back above Liquidity Zone #1, which had served as a prior consolidation band.
Market watchers now track the red breakout zone where the broken trendline meets a neckline-type resistance. A close above this area could allow ZEC bulls to regain control, though failure to clear it may send prices back toward earlier liquidity areas.
Macro Structure Develops on XVGT
A multi-year view that outlined long-term wave formations pointing to a possible completion phase after an extended downtrend. The asset display suggested alternating cycles of accumulation and distribution.
That region previously acted as a supply band, and the projection framed it as a possible point for a future macro peakThe chart then suggested a gradual recovery phase that may take shape after that correction.
Market Cap Shows Sharp Volatility
A separate 7-day market capitalization chart showed a wide range between 7 billion and 12 billion dollars. The trend moved downward from November 17 to 19, forming a sequence of lower highs and lower lows before stabilizing.
A strong bounce appeared between November 20 and 21 as capitalization climbed toward the 11 billion level. This upswing indicated renewed activity after several days of pressure. The move formed a rounded peak before markets shifted again.
A sharp decline followed on November 21 and 22, driving the total below 8 billion. The chart then showed a fast V-shaped recovery on November 23, with capitalization rising back above 9 billion as demand returned.