- Zcash tests the $520 demand zone, showing strong buying pressure that could trigger a sharp rebound and continuation of the uptrend.
- Historical supply around $680–$720 capped gains, but the demand zone absorbed selling, preventing further declines and supporting price stability.
- Ascending triangle and liquidity sweep patterns indicate potential bullish follow-through, suggesting ZEC could aim for $800 if momentum holds.
Zcash ($ZEC) faces critical momentum as the cryptocurrency tests its key demand zone near $520. On Binance, $ZEC trades at $517.60, gaining 0.81% over recent sessions. Analyst Farzad noted, “At the moment, $ZEC is sitting in a strong demand zone, and I expect a sharp rebound in the near future.”
The cryptocurrency reached peaks near $740 before undergoing correction, creating distinct supply and demand zones. The current setup hints at possible continuation of the uptrend, provided the market confirms breakout strength around $700. Trading volume stands at 125.06K ZEC, reflecting significant market activity.

The Zcash rally began in early November from roughly $320. The asset climbed steadily, forming a horizontal supply zone between $680 and $720. Multiple rejections from this offer zone confirmed resistance, while the demand zone between $480 and $520 absorbed selling pressure effectively.
Farzad emphasized, “The demand zone should overpower the supply zone, paving the way for higher highs and higher lows as the uptrend progresses.” Consequently, buyers regained control near $520, preventing further decline. The upward trajectory remains intact, indicated by the blue trend line connecting November lows to current prices.
Ascending Triangle Patterns and Liquidity Sweeps
Analyst Ardi highlighted a “Busted” Ascending Triangle scenario. He stated, “Price breaks down first, sweeps liquidity as a fakeout, then snaps back above the trendline and pushes through the opposite side with strength.”
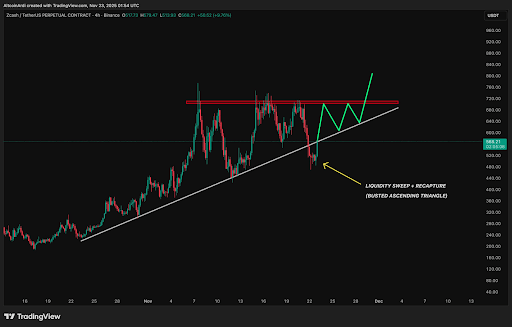
ZEC tested the $720 horizontal resistance multiple times during consolidation, forming the triangle with a rising trendline from mid-October’s $240 lows. A brief breakdown occurred near $520, temporarily breaching the trendline.
However, the asset quickly recaptured the trendline, aiming toward $800 according to projections. The pattern suggests strong bullish follow-through after failed breakdowns, aligning with Thomas Bulkowski’s research on liquidity sweeps.