
- XRP trades near $2.29, consolidating within a symmetrical triangle with key resistance at $3.00 and support above $2.00.
- Elliott Wave structure signals structured consolidation, with price testing both trendlines multiple times in recent sessions.
- A breakout above $3.00 could push XRP toward $3.50, while a breakdown below $2.00 may trigger further losses.
XRP has been consolidating within a symmetrical triangle, reflecting price compression. The asset is trading around $2.29291, showing a 0.81% decline. The buy price stands at $2.28916, while the sell price is at $2.28832. Key resistance levels remain near $3.00, with support levels holding above $2.00.
Market Analysis by CryptoGeek
According to CryptoGeek, XRP is approaching the final phase of its correction. A breakout could push the cryptocurrency price beyond $3.00. The Elliott Wave structure, labeled (A) to (E), defines the market’s movement inside the triangle. Wave (A) initiated an upward move, followed by (B) reaching price resistance, and (C) testing support.
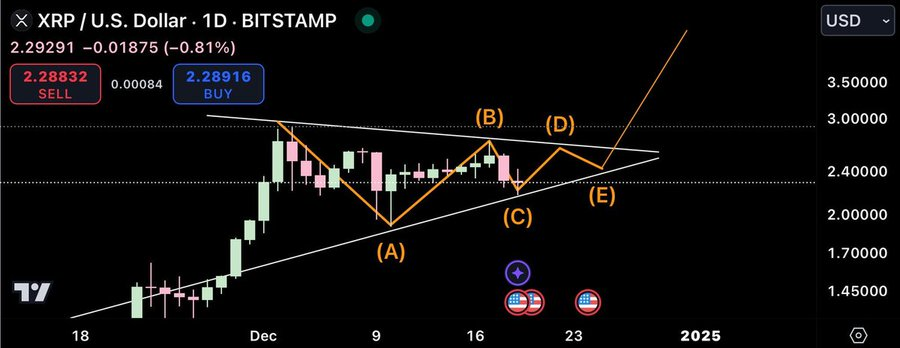
Wave (D) rebounded toward resistance, while (E) approached the lower boundary. The price has tested both trendlines multiple times, confirming structured market consolidation. Volume levels remain moderate, indicating neutral participation from market players. The technical analysis suggests that the symmetrical triangle structure remains intact within the observed timeframe.
Steph is Crypto also analyzed the XRP time frame, presenting a descending triangle formation with price action compressing between trendlines. The pattern spans 86 days, reflecting prolonged consolidation before a breakdown. The descending trendline shows lower highs, reinforcing selling pressure within the observed timeframe.
Price Action and Support Levels
The price initially surged in December before entering consolidation. XRP fluctuated within a rectangular price range, testing both resistance and support. The asset remains confined between $2.00 and $2.50, establishing a psychological support level. A breakout could see $3.50 acting as the next resistance.
Indicators reflect compression within the symmetrical triangle, aligning with historical trends. The descending trendline shows a sequence of lower highs, confirming selling pressure. A downward move below $2.00 could lead to further losses. The time frame structure aligns with observed historical crypto market trends.