
- XRP RSI near 71.50 can lead to a massive breakout or a pullback, so traders consider this level significant.
- A falling wedge is forming, mimicking past patterns that have come before sharp price increases.
- XRP’s price movement is following along with previous accumulation phases, setting the stage for a volatile move to the higher side.
XRP’s Relative Strength Index (RSI) is at critical levels and might possibly show a shift of market momentum. Market analysts are studying previous patterns and price movement to take into consideration whether XRP will break or face resistance.
RSI Trends and Key Resistance Levels
EGRAG CRYPTO has indicated that XRP’s RSI has increased from 60.00 to 68.55. The strongest resistance level of 71.50 remains the key to further gains. Closing above this point might push RSI towards 80.00, which in the past has been associated with overbought and price reversal.
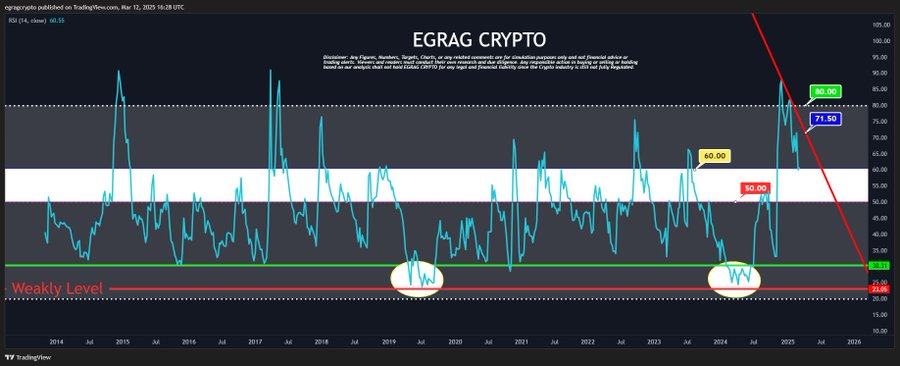
EGRAG notes that unless RSI breaks below 71.50, an eventual pullback to lower support levels should be possible. Market participants can watch for reactions at the 50.00 level, where momentum shifts are most likely to happen. A persistent drop below this midpoint can reflect diminishing bullishness and lead to longer-term consolidation or bearish action.
Tracking the RSI trends, downward trendline reflects declining momentum from recent peaks. Despite this, RSI has remained within a structured range, where 50.00 serves as a midpoint between bullish and bearish sentiment. Support at 29.61 has previously triggered rebounds, indicating potential buying interest if RSI moves lower.
Possible Breakout Scenarios and Market Structure
Javon Marks analyzes XRP’s market structure, comparing the current RSI setup to previous breakouts. A past RSI wedge breakout preceded a 500% price surge. The emerging descending wedge pattern suggests a tightening range, potentially leading to another breakout.

Javon confirms that XRP’s price remains in a consolidation zone, encountering resistance at the upper boundary and support at the lower boundary. The RSI’s downward trajectory signals contraction within the wedge, resembling previous bullish breakout formations. Analysts note that preserving the current structure could create conditions for a price increase.
The analysts observe that XRP’s RSI patterns align with past market cycles. If RSI holds momentum above key resistance levels, an upward breakout could follow. The market structure continues to mirror previous accumulation phases, reinforcing the potential for strong movement.