

- XRP moves in a clear pattern where dips lead to strong rallies that repeat over time.
- The current cycle suggests a short cooldown but the overall trend stays strong.
- If XRP stays above key price levels it is likely to keep moving higher.
XRP has aligned itself with a crucial confluence of time cycles, potentially marking a significant bottom across multiple timeframes. According to technical analyst Dr. Cat, XRP has already satisfied cyclical timing on the daily, weekly, and monthly charts, with the 101-day cycle acting as a major anchor point. This raises an intriguing question: If Bitcoin ($BTC) experiences a hard dump, will XRP necessarily revisit previous lows, or has it already completed its corrective structure?
Breaking Down XRP’s Daily Time Cycle
On the daily chart, XRP exhibits a structured price movement, forming three distinct cycles of 33 days, 83 days, and 101 days, leading to its latest breakout. The 101-day period is of particular interest, as it encapsulates a prolonged accumulation phase before the sharp rally. Notably, volume expansion aligned with these time clusters, increasing from 461.67M to 2.47B, reinforcing that institutional activity likely played a role in the breakout.
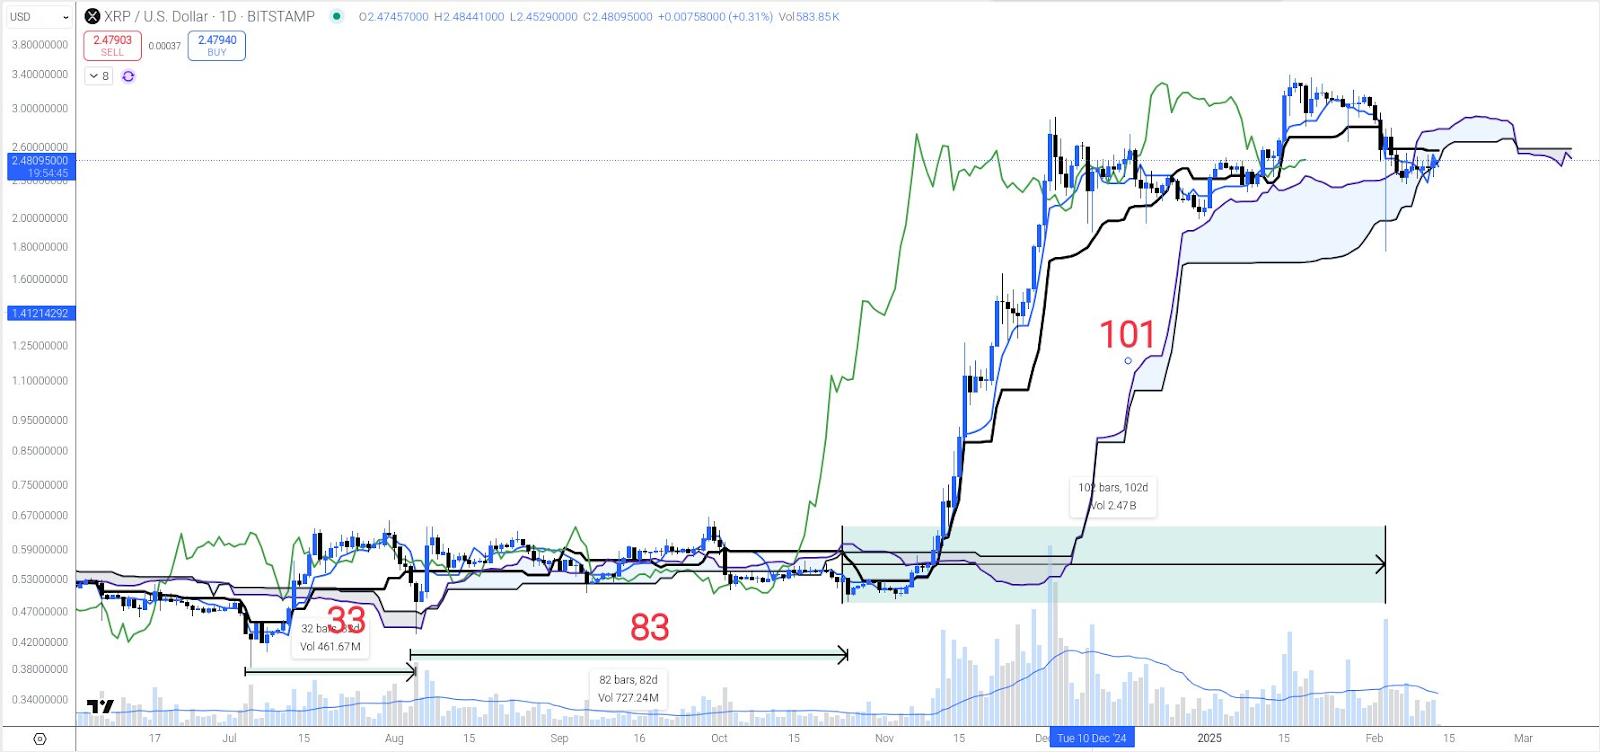
The Ichimoku Cloud indicator reveals that XRP decisively broke above resistance, confirming bullish intent. However, a retracement remains a possibility if BTC’s performance falters. Despite this, Dr. Cat suggests that XRP is not “pending to do it”, meaning it has already met the structural demand required for a bottom.
Weekly Chart: 17-Day Cycles and Major Structural Shifts
The weekly timeframe provides further confirmation of XRP’s cyclical behavior. The data highlights two key 17-bar (119-day and 112-day) cycles, sandwiching a 33-week accumulation period. These repetitive cycles indicate that XRP follows a regimented structure, often breaking out after consolidating within the Ichimoku Cloud.
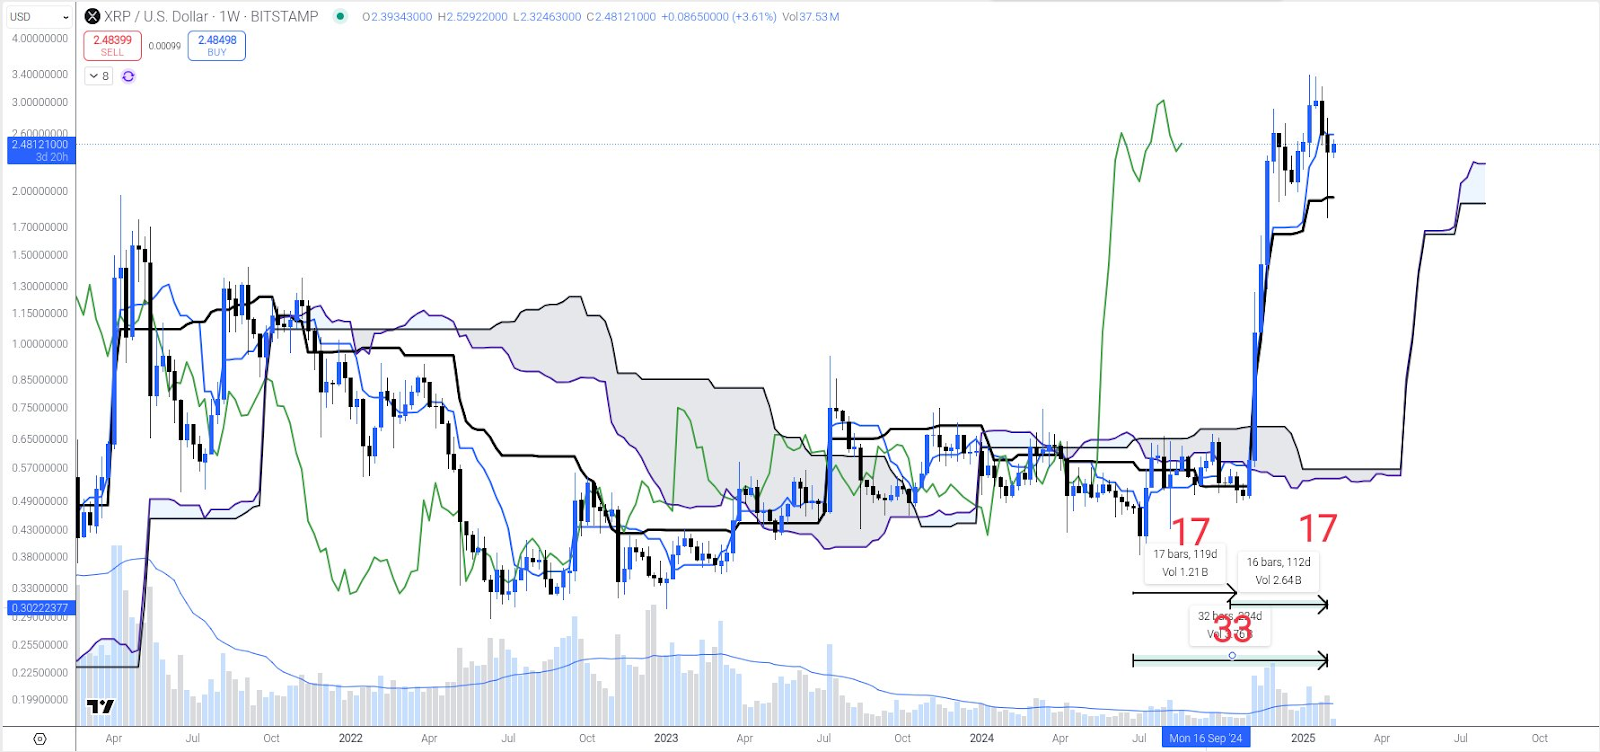
Volume analysis paints an even clearer picture: The second 17-week cycle recorded a substantial volume surge to 2.54B, more than doubling from the previous 1.21B.
Monthly Outlook: 9-17-26-9 Cycle Formation
Zooming out to the monthly chart, XRP follows a well-defined 9-17-26-9 cyclical rhythm, demonstrating structured price movements over extended periods. The 9-month dips observed at two key junctures acted as precursors to major rallies, while the 17-month and 26-month cycles bridged the gaps, providing the necessary momentum for sustained upward movement.

The 10-bar cycle spanning 304 days laid the foundation for a 17-bar rally lasting 577 days, which ultimately resulted in a significant price surge. Following this, XRP entered a 26-month accumulation phase (792 days)—a period of consolidation that allowed for market stabilization before the explosive breakout that followed.
Currently, the latest 9-month cycle (245 days) signals a potential cooldown phase. However, the broader bullish structure remains intact, with historical cycles reinforcing the likelihood of continued upward momentum.