
- XRP nears a breakout as RSI signals momentum, with Fibonacci levels reinforcing key support and resistance zones.
- The market structure mirrors past bullish patterns, suggesting potential rallies toward $5.85 and $8.76 per Fibonacci extensions.
- RSI and Ichimoku Cloud confirm trend strength, with analysts forecasting a Wave 3 breakout and sustained bullish momentum.
XRP is nearing a critical breakout on the daily chart as consolidation phases approach completion. The Relative Strength Index (RSI) indicates strong momentum, with key support levels at $1.88 and $2.33. Analysts observe similarities between the current market structure and past bullish patterns. The next price targets are projected at $5.85 and $8.76 based on Fibonacci extensions. With technical indicators aligning, XRP prepares for an upward move.
Market Structure and Fibonacci Levels
XRP’s price follows a structured pattern, forming accumulation phases before experiencing breakouts. The Fibonacci retracement levels of 38.2% and 61.8% are marked at $2.77 and $2.44. These levels act as crucial support and resistance areas, influencing market behavior.
A strong upward movement is visible after an initial accumulation phase. Price consolidates within a defined rectangular range before breaking out into a rally. A similar setup emerges again, with a correction forming a rounded bottom. A downward-sloping resistance trendline signals a corrective phase before the expected breakout.
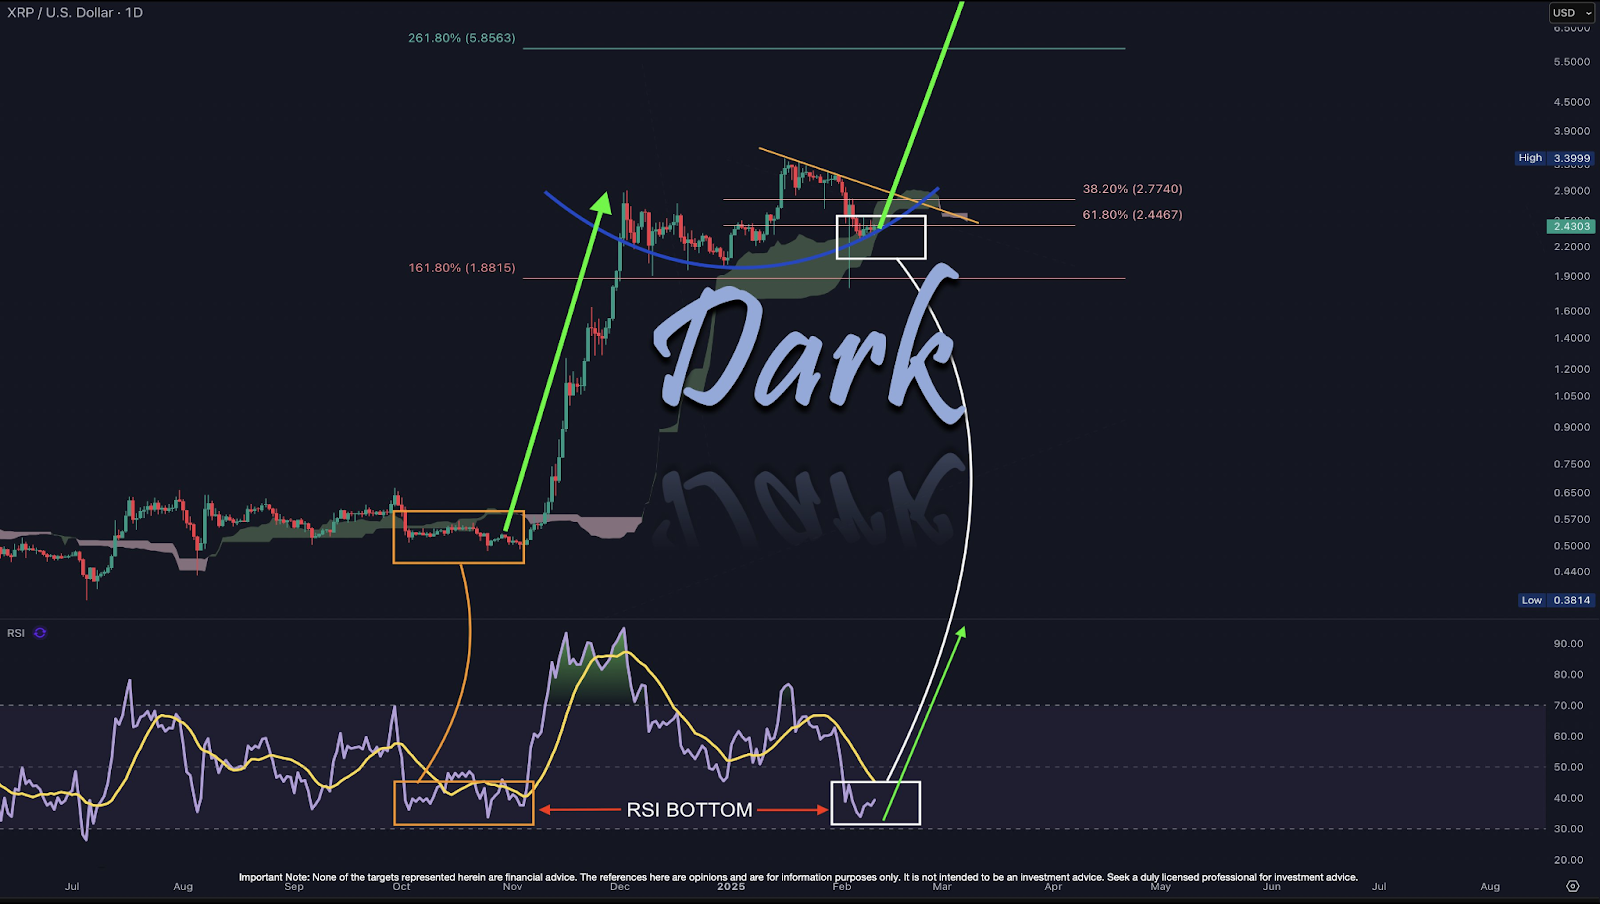
RSI and Ichimoku Cloud Confirmations
The RSI indicates momentum shifts, showing historical patterns that align with XRP’s previous bullish rallies. A prior RSI bottom led to a strong uptrend, and the current RSI position suggests a potential reversal. The yellow moving average line interacts with RSI levels, confirming trend changes.
Moreover, the Ichimoku Cloud provides dynamic support and resistance insights. XRP interacts with the cloud during pullbacks, reinforcing trend re-entry points. The white box highlights a potential bounce area, aligning with Fibonacci levels and structural support zones.
Projected Price Movements and Analyst Insight
Analyst Dark Defender reports that XRP’s Wave 3 is preparing to breach resistance, aiming for $5.85 as an initial target. Fibonacci extensions point to further bullish potential, with $8.76 as an extended target. Historical data indicates similar patterns preceding price surges, reinforcing bullish expectations.
With XRP consolidating and indicators aligning, the market anticipates a decisive breakout. The combination of RSI trends, Fibonacci levels, and historical performance supports a bullish outlook. However, traders should assess market conditions before making investment decisions.