
- XRP needs a strong close above $2.75 to confirm bullish momentum, with targets at $2.94 and major resistance at $3.40.
- Failure to hold support could push XRP lower, testing $2.00, though strong demand zones suggest potential rebounds.
- Market volatility is high, with trendlines shaping key levels; traders watch the “Face Melting Phase” for breakout signals.
Egrag crypto technical analysis of XRP’s price action on the 4-hour timeframe reveals the crypto trading at $2.5890 with a high of $2.7768 and a low of $2.5890. According to the latest market structure, XRP needs a strong close above $2.75 to confirm bullish momentum. The next key target remains $2.94, followed by a major resistance at $3.40.
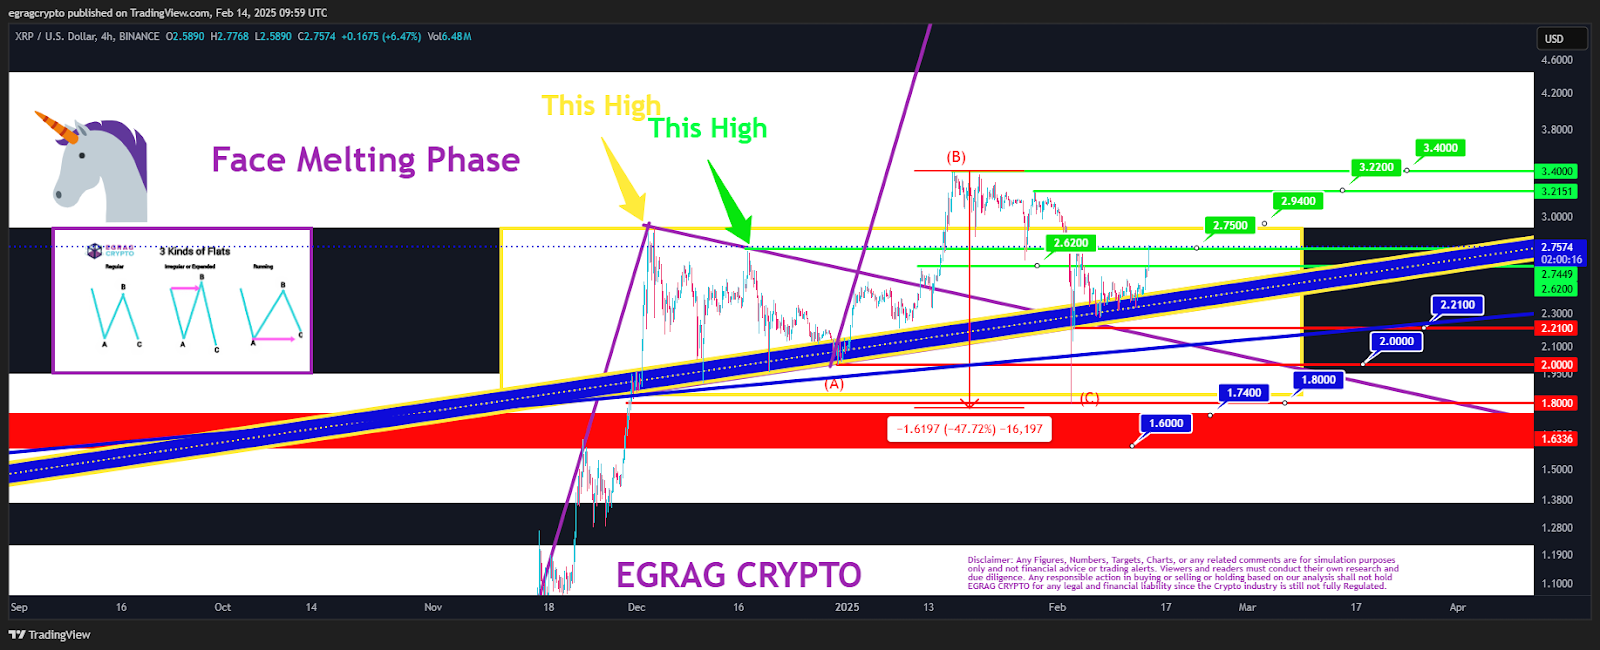
Besides, a failure to hold above support levels could push the price lower, possibly testing levels around $2.00. However, multiple trendlines and key support zones indicate strong demand in the lower-price regions. The technical outlook presents a combination of Fibonacci-based analysis and trendline structures, offering traders valuable insights.
Key Resistance and Support Levels
XRP has resistance zones at $2.6200, $2.7500, $2.9400, $3.2200, and $3.4000. Each of these levels represents a point where price reactions could occur. Moreover, A push towards $3.40 might result from breaching above $2.94. It is a critical breakout point, though, because the market has encountered strong resistance at this level.
On the downside, the $1.8000, $1.7400, $1.6000, and $1.6336 are critical support levels. In a prior steep price decline, XRP fell -47.72%, hitting a low of $1.6336 before rising again. Consequently, this area serves as a crucial demand zone. The red-marked region represents a major support zone where buyers have historically stepped in.
Market Structure
XRP has been trading within a phase labeled the “Face Melting Phase.” This phase suggests strong volatility and the potential for rapid price movements. Additionally, intersecting trendlines indicate critical structural levels influencing XRP’s movement. A thick blue trendline acts as a dynamic support level, while the yellow dashed line represents an overhead resistance.