
- XRP daily chart prints a TD Sequential buy after a controlled corrective phase.
- Intraday trading reflects active demand near recent lows with balanced volume.
- Price remains range-bound as market participants await directional confirmation.
XRP is stabilizing following the recent volatility due to technical indicators that there is relaxed selling pressure. Price action is a sign of moderation and not panic, and a trader observes confirmation levels before settling on an evident directional prejudice.
Daily TD Sequential signal suggests stabilization
A recent Ali Charts tweet drew attention to a TD Sequential buy signal on the daily XRP chart. The signal appeared after a controlled pullback, rather than following an extended rally. This positioning suggests downside momentum has slowed materially. Such conditions often align with short-term stabilization phases.
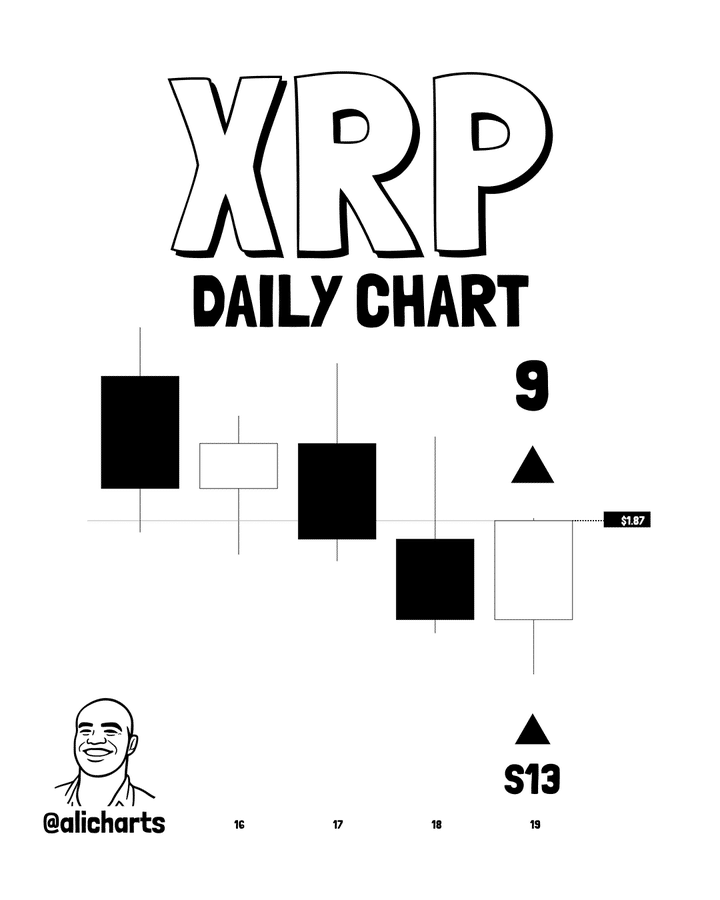
The daily sequence completed a bearish candle count before printing a reaction candle. This structure aligns with standard TD Sequential buy criteria. It indicates selling pressure may have been absorbed near current levels. Daily signals tend to reflect broader market psychology.
Candle structure supports this interpretation through longer wicks and tighter real bodies. These features often point to indecision rather than aggressive selling. Price has continued to hold above visible structural support zones. The market appears to be transitioning into a base-building phase.
Intraday price action reflects equilibrium
The intraday trading provides additional details to the rest of the XRP story. XRP is currently trading around the $1.86 level following a session that saw extreme movements and convergence. Price made an early effort to reach the price zone of $1.92 then withdrew. The retracement unfolded in an orderly manner.
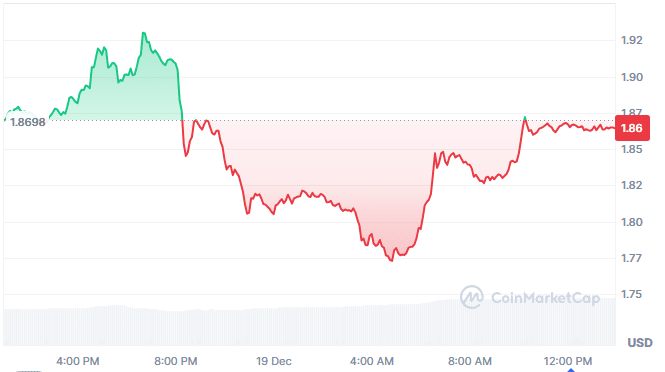
The decline found support near the $1.77–$1.78 zone. Buyers responded quickly, driving a swift recovery back into the prior range. This reaction confirmed that demand remains active at discounted levels. However, follow-through weakened near resistance.
Volume increased during both the selloff and rebound phases. This pattern suggests rotation rather than capitulation. Two-sided participation is common during consolidation periods. Markets often pause this way before choosing direction.
Support and resistance guide near-term outlook
Structurally, XRP is consolidating below minor resistance near $1.88. Holding above the $1.82–$1.84 area keeps the short-term structure intact. This zone has become a focal point for near-term positioning. A sustained break above $1.90 would shift momentum perceptions.
On the downside, a loss of current support could expose another test of the $1.78 region. That level has already acted as a reaction low during the recent swing. Repeated tests can weaken demand if not followed by higher highs. For now, buyers continue to defend the area.
In general, XRP is trapped in a range following volatility squeezes. Buyer and seller seem to be equally matched at existing prices. Directional clarity is likely to emerge from a range resolution. Until then, price behavior reflects balance rather than dominance.