
- XRP approaches a critical breakout level at $2.33 with strong support from converging moving averages and bullish RSI momentum.
- Historical triangle patterns suggest a major upside potential with Fibonacci targets pointing toward $6.31 and possibly $17.25.
- Price consolidation above $2.30 mirrors 2017’s breakout setup, signaling growing momentum for a possible multi-cycle rally.
XRP is showing strong bullish momentum across multiple timeframes. On the daily timeframe, the price nears a critical resistance at $2.33. A breakout above this level could mark a decisive trend shift. As of writing, XRP trades at $2.31, following a rebound from its 200-day moving average. The technical setup shows bullish indicators aligning at key support. Momentum is also building steadily. Consequently, traders anticipate volatility as price compresses near resistance.
Daily Chart Shows Momentum Building
According to market analyst Dark Defender, XRP is on the verge of a major breakout. The price sits just below a long-term descending resistance. This trendline has rejected every rally since late 2024. Hence, a daily close above $2.33 could trigger a sustained bullish wave. Moreover, moving averages at the 50, 100, and 200-day levels converge beneath the current price. This confluence creates strong technical support.
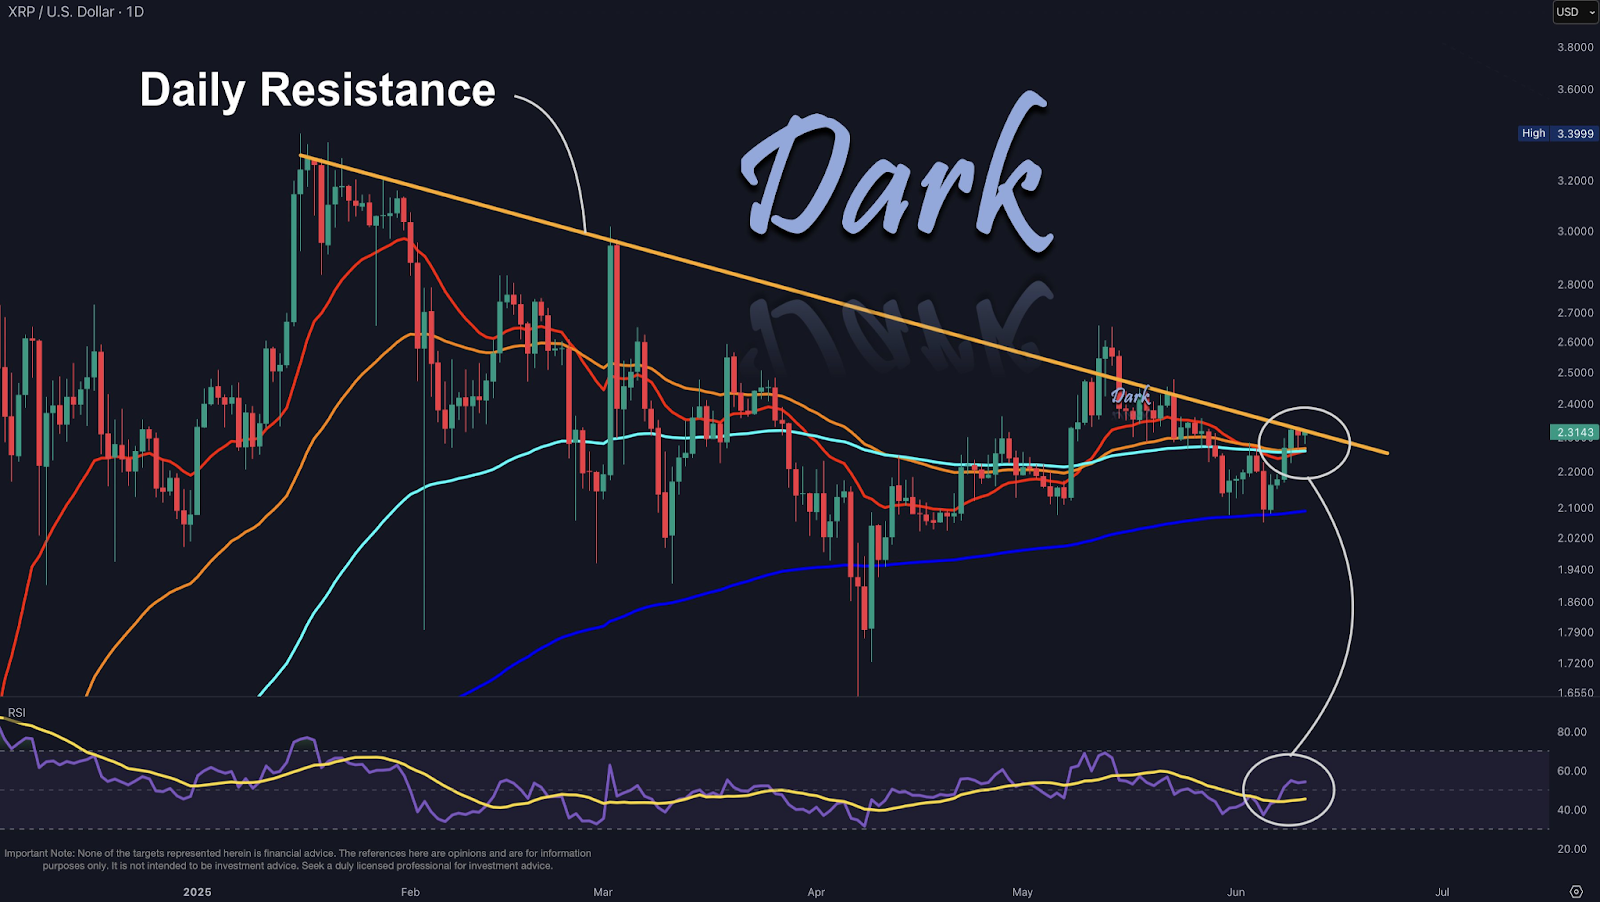
Source: Dark Defender
Additionally, the RSI has broken above its descending trendline. It now reads close to 60, suggesting rising strength without reaching overbought territory. Recent candlesticks show lower shadows, confirming buyer interest near the 200-day average. This indicates growing demand at support zones. However, price remains within a descending channel, and confirmation is required before shifting to full bullish mode.
Multi-Year Pattern Signals Explosive Potential
JavonMarks highlights a broader structure on the 2-week chart. XRP has formed two symmetrical triangles since 2014. The first breakout in 2017 led to a 3,200% rally. Similarly, the second triangle recently broke above horizontal resistance around $1.00. After reclaiming its 2018 high of $3.30, XRP entered a consolidation range above $2.30.
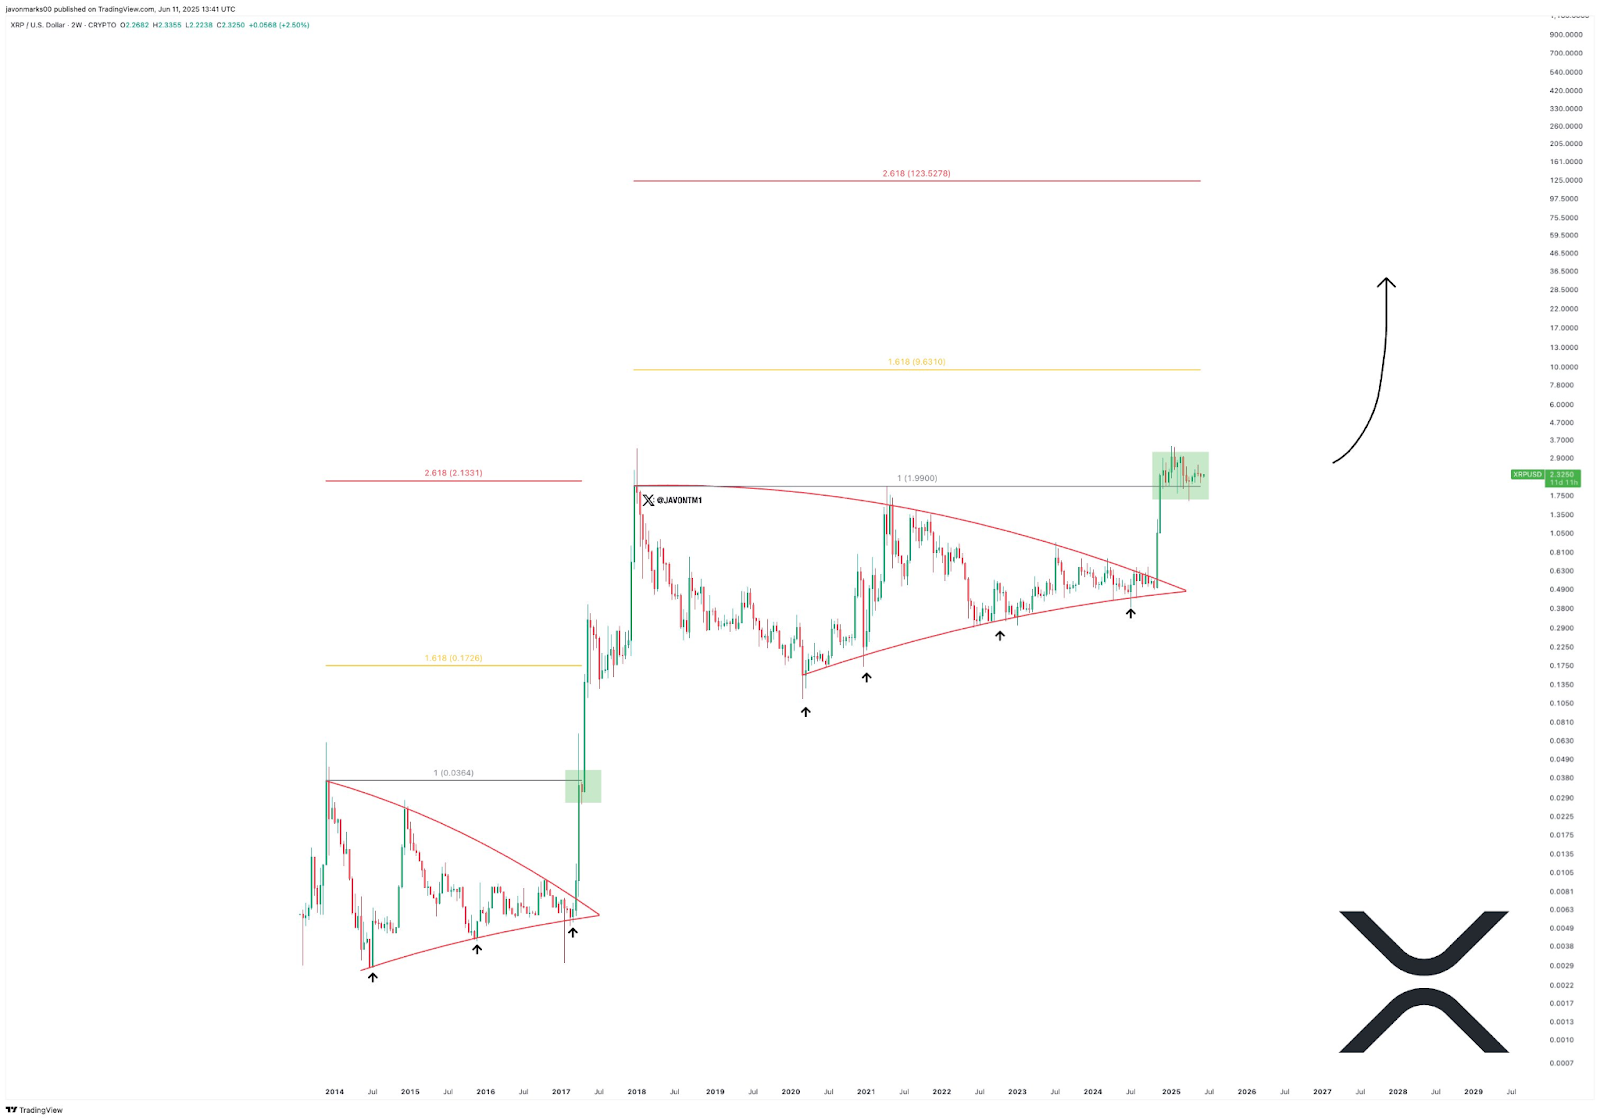
Source: Javon Marks
Besides, Fibonacci extensions from the latest breakout zone suggest long-term targets. The 1.618 level sits at $6.31, while the 2.618 marks $17.25. Price behavior mimics the 2017 breakout, with consolidation setting the stage for further gains. Each triangle featured higher lows and tightening range structures. These breakouts typically lead to large impulsive moves.
Consequently, XRP’s current structure appears bullish in both short and long-term outlooks. While resistance remains strong at $2.33, momentum is clearly shifting. Moreover, historical fractals support a breakout scenario. Traders continue watching this zone closely, as a daily close above resistance could redefine the trend.