
- XRP dropped by 22% from its $3.70 high; a TD Sequential 9-count and rising sell volume signal short term exhaustion.
- RSI at 45.16 and bearish MACD crossover show weakening momentum as price tests key $2.65 support level.
- If $2.65 breaks, XRP may drop to $2.30–$2.40 or $1.93; broader trend remains bullish but consolidation is needed.
XRP price is undergoing a correction phase after its recent rally peaked near $3.70 in July. The digital asset, which had surged from around $1.85, has lost over 22% in value since reaching its recent high.

According to analyst Ali, a TD Sequential 9-count flashed on the 3-day chart just before the reversal began. This signal, followed by multiple bearish candles, suggests the rally may have exhausted short term momentum.
Resistance Flips to Barrier as Pullback Extends
XRP price shows resistance forming around $2.95 to $3.00, an area that previously acted as support. This change shows weakening market structure. The asset also had strong rejection between $3.40 and $3.70, the recent top zone.
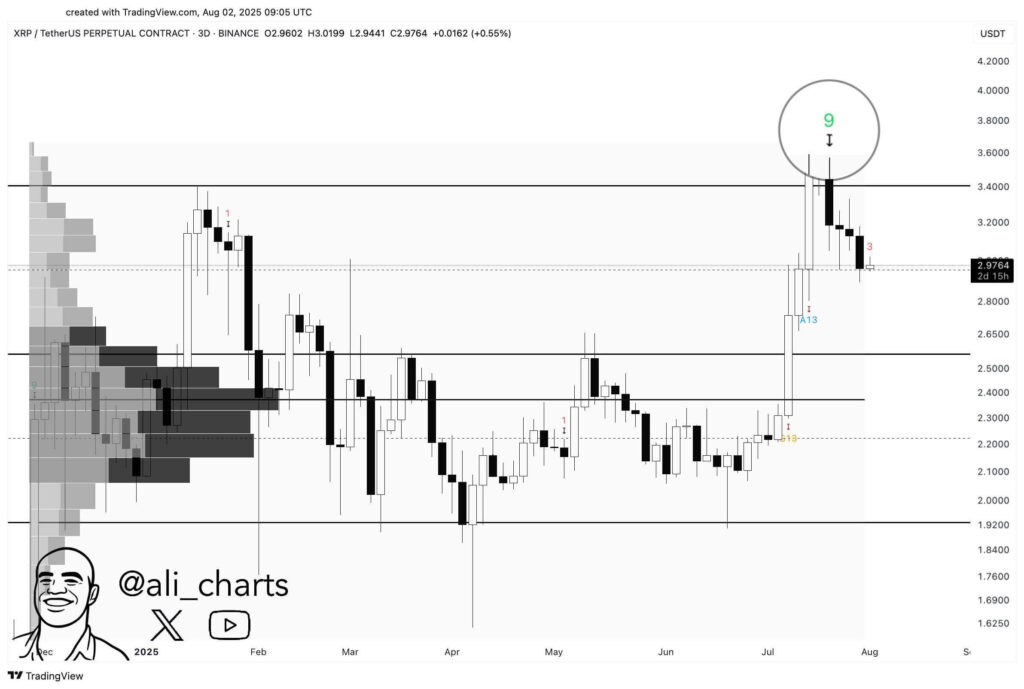
The wick heavy peak at these levels confirmed notable selling interest as buyers struggled to push higher. Volume data shows increased activity during the decline, with daily volume at 46.06 million.
The ongoing correction follows a breakout above the $2.20–$2.50 range in mid-July. However, this breakout now appears overstretched, with the pullback cutting deep into recent gains.
RSI and MACD Indicators Point to Weakening Momentum
Momentum indicators further confirm the current retracement trend. The RSI dropped to 45.16, down from an overbought level above 70. This movement below the neutral 50 mark signals growing bearish pressure without yet hitting oversold levels.
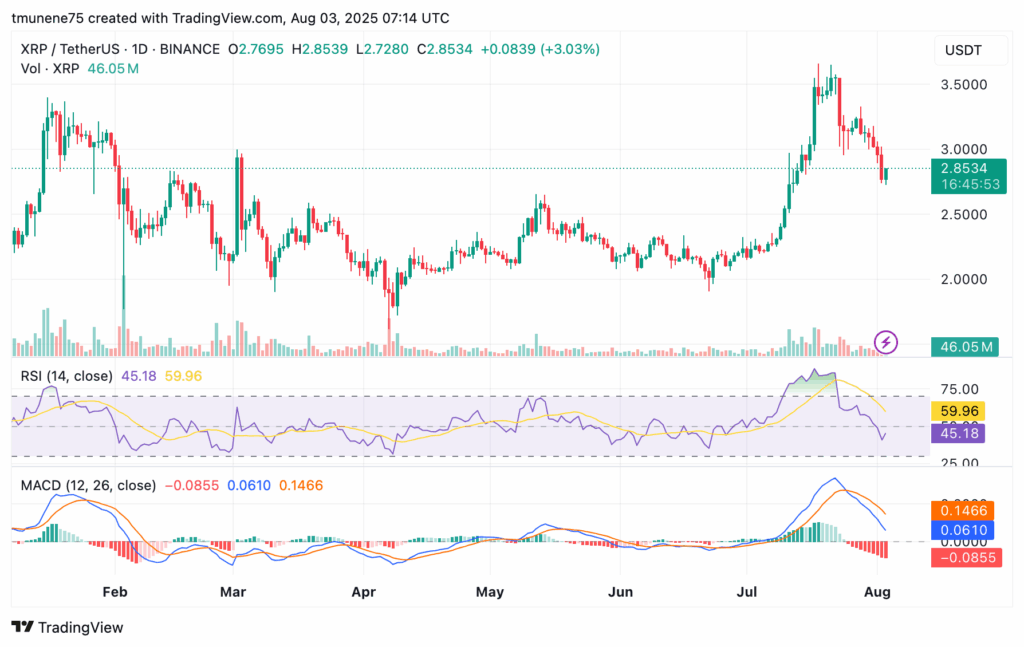
The MACD also shows a downward movement. The MACD line now is 0.0610, below the signal line at 0.1466, while the histogram holds at –0.0856. This setup shows continued downside risk unless bulls step in to reclaim higher levels.
Market Structure Holds if $2.65 Support Remains Intact
As the asset continues to correct, $2.65 could be the next short term support. A breakdown below this level could lead to a move toward the $2.30–$2.40 region, which aligns with high volume accumulation zones. Additional downside may expose XRP to support near $1.93 if momentum weakens further.
Still, XRP maintains a broadly bullish pattern on higher timeframes, but consolidation is needed to stabilize price action. Support levels at $2.75, $2.50, and $2.30 now be key in determining the next move.
Overall, XRP’s price shows a cooling phase after a strong rally. With indicators flashing short term weakness and resistance levels holding firm, the market focus is now on whether key support zones will prevent a deeper decline.