- XRP’s symmetrical triangle pattern on the monthly chart indicates a potential bullish breakout.
- Stochastic RSI and RSI indicators suggest XRP might be transitioning from oversold conditions, signaling upward momentum.
- Ripple CEO hints at a possible resolution to SEC legal issues soon, adding to the anticipation for XRP’s future movements.
According to @ChartingGuy on X, XRP is showing signs of a major upward movement. Several technical indicators suggest bullish momentum for the cryptocurrency, backed by a detailed analysis of its price movements and market trends.
This analysis comes amidst speculation about the resolution of Ripple’s ongoing legal battle with the SEC, with CEO Brad Garlinghouse hinting at a possible conclusion soon.
Technical Patterns Point to Potential Breakout
XRP is displaying several promising patterns on its monthly chart, indicating potential bullish movement. A symmetrical triangle pattern is forming, often a precursor to a breakout.
With the current price at $0.60714, the formation suggests a possible upward movement after reaching point E of the pattern. Historical data shows significant price spikes followed by consolidation, indicating the potential for another major breakout.
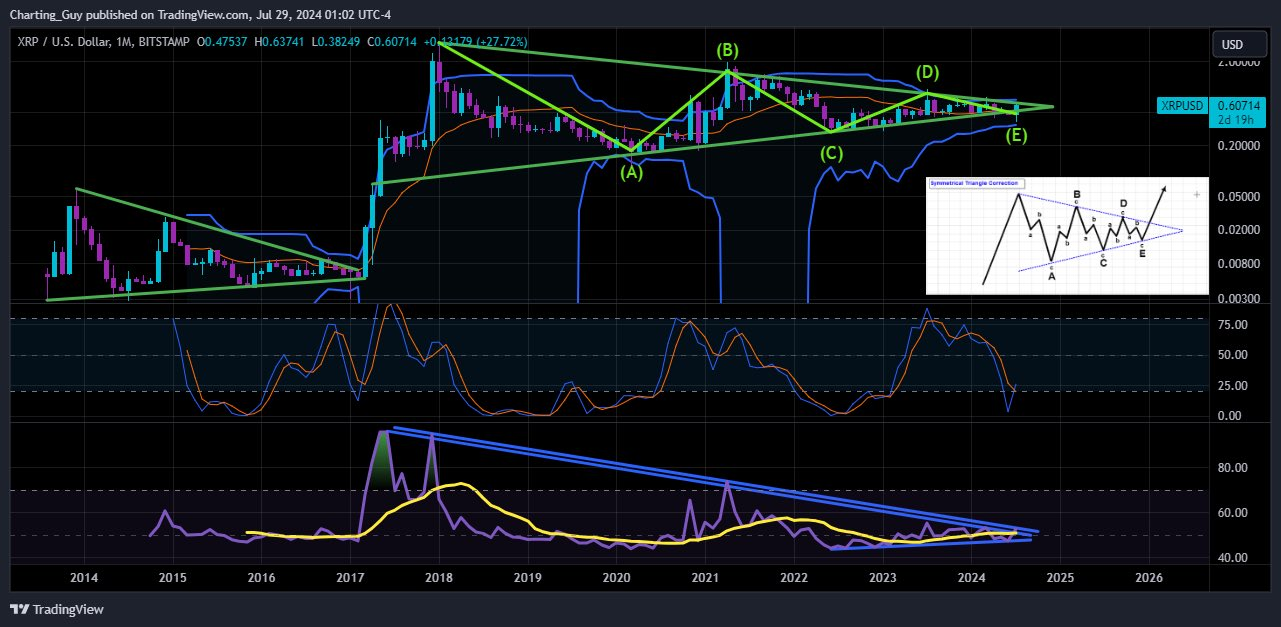
Source: Charting Guy on X
Stochastic RSI and RSI Indicators Signal Bullish Momentum
The Stochastic RSI, which measures overbought and oversold conditions, suggests an upward reversal. Recently, it indicated that XRP might be transitioning from an oversold state.
The Relative Strength Index (RSI) is also approaching a breakout point from a long-term downtrend. A breakout here would signal bullish momentum, aligning with the symmetrical triangle pattern.
Weekly Market Capitalization Analysis
On a weekly timeframe, XRP’s market capitalization shows a recent uptrend after a period of downtrend and consolidation. The current market cap is $34.035 billion, with a weekly range between $33.593 billion and $34.186 billion.
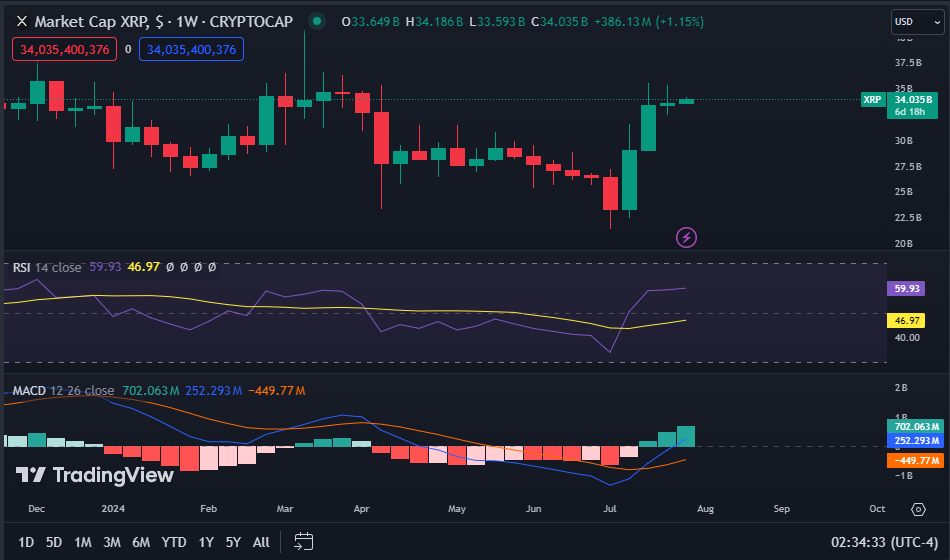
Source: TradingView
The RSI on this chart has risen above 50, indicating increased buying momentum. The MACD (Moving Average Convergence Divergence) line is above the signal line, further supporting the bullish sentiment.
Implications of Legal Developments
CEO Brad Garlinghouse recently mentioned in a Bloomberg interview that a resolution to Ripple’s legal issues with the SEC could come “very soon.” While he did not confirm ongoing settlement negotiations, his comments have fueled speculation about a favorable outcome. An SEC meeting, postponed to July 25, will address litigation claims and other enforcement matters, adding to the anticipation.
Future Projections
Overall, technical indicators and recent developments point towards a bullish outlook for XRP. The symmetrical triangle pattern, coupled with bullish signals from the Stochastic RSI and RSI, suggests a potential upward movement.
Market capitalization analysis further supports this sentiment. The next few periods will be crucial in confirming this trend, particularly with the potential resolution of Ripple’s legal issues on the horizon.