
- XRP’s breakout echoes its 2017 bull run, signaling a potential parabolic surge with price targets as high as $94.27.
- Historical patterns show XRP thrives on long consolidations before explosive moves, with an 11,000% rally now on analysts’ radar.
- Technical indicators reveal mixed signals, but rising buying pressure suggests XRP could retest $3.00 before a major breakout.
XRP is giving the appearance of strong breakouts reminiscent of its 2017 bull run. The price recently tested an all-time high, just as it did before consolidation into the explosive 2017 rally. Analysts speculate this could provide a path for a mega-rally price jump to highs of $99. If past results are anything to go by regarding pattern repetition, then XRP is due for a historical price movement.
XRP’s Historical Parabolic Moves
Historically, XRP has exhibited extended periods of consolidation that typically break out into violent price eruptions. Between 2014 and early 2017, one such symmetrical triangle pattern emerged. After several tests of resistance, XRP finally broke out, surging by more than 62,528% to peak at $3.27 in early 2018. This set the precedent for future bullish cycles.
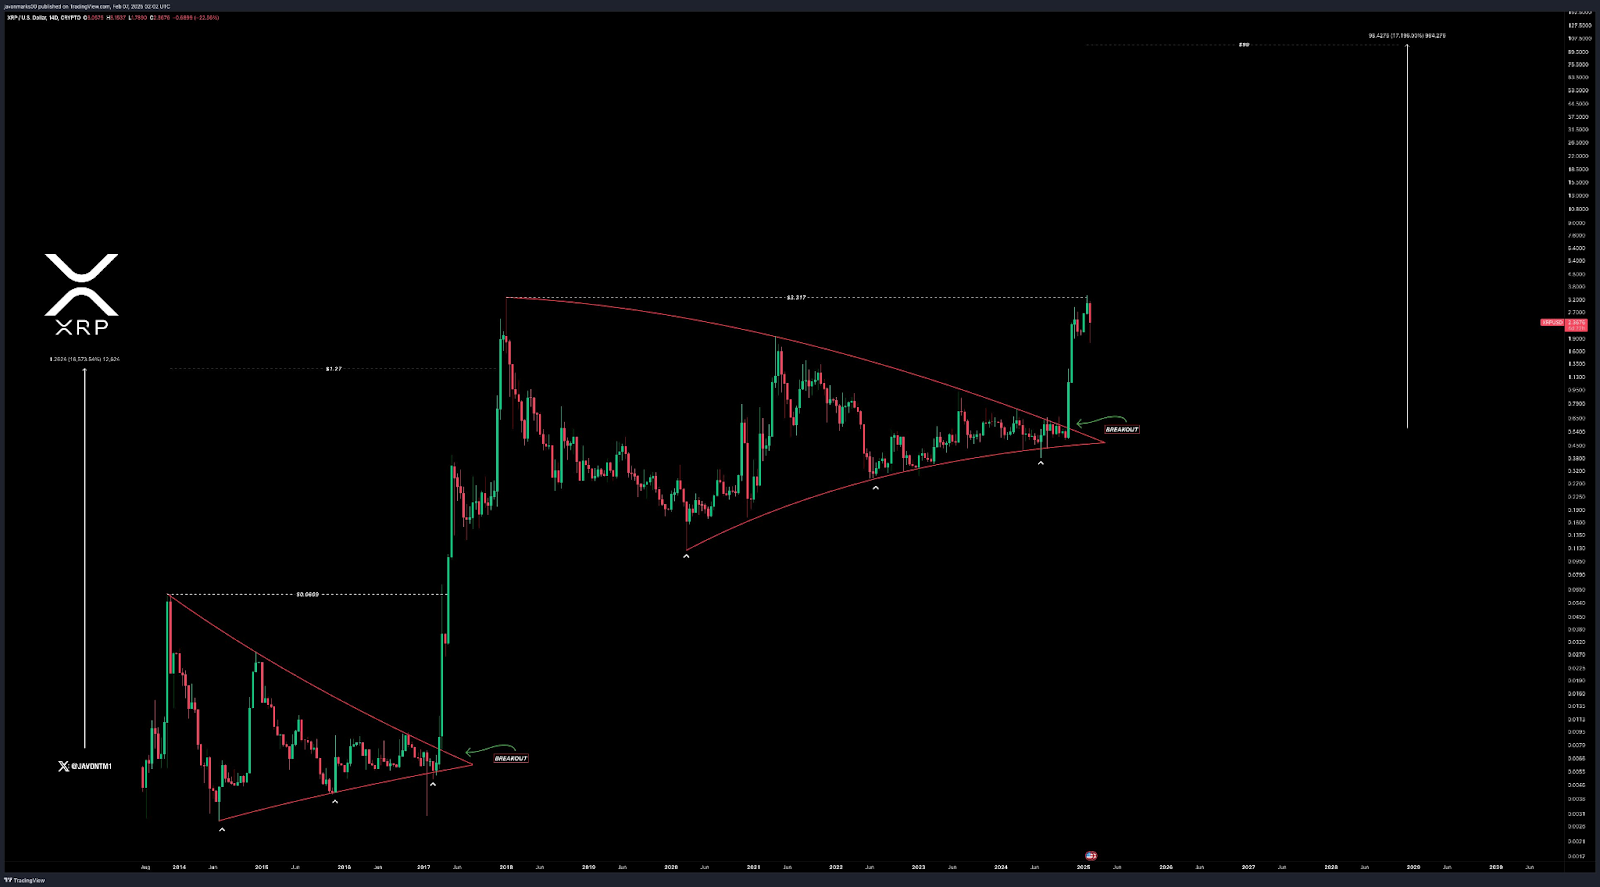
A similar pattern formed between 2018 and 2023, with resistance near $0.827. After a prolonged consolidation phase, XRP finally broke out in 2024, echoing its previous rally. Market analysts believe this new breakout could lead to a parabolic run, with a projected price target near $94.27. Such a move would represent an astonishing 11,000% increase from its breakout level.
Technical Indicators and Market Trends
The market capitalization of XRP currently stands at approximately $136.32 billion. Its price action remains within a descending channel, signaling a potential breakout upon surpassing resistance. If XRP breaches this crucial level, it could revisit $3.00 before pushing higher.
Key technical indicators, including the RSI Divergence Indicator, highlight mixed signals. The RSI stands at 52.78, suggesting neutral momentum. Bullish divergences at various lows indicate increasing buying pressure. Meanwhile, bearish signals at local peaks suggest resistance zones that could limit upward momentum.
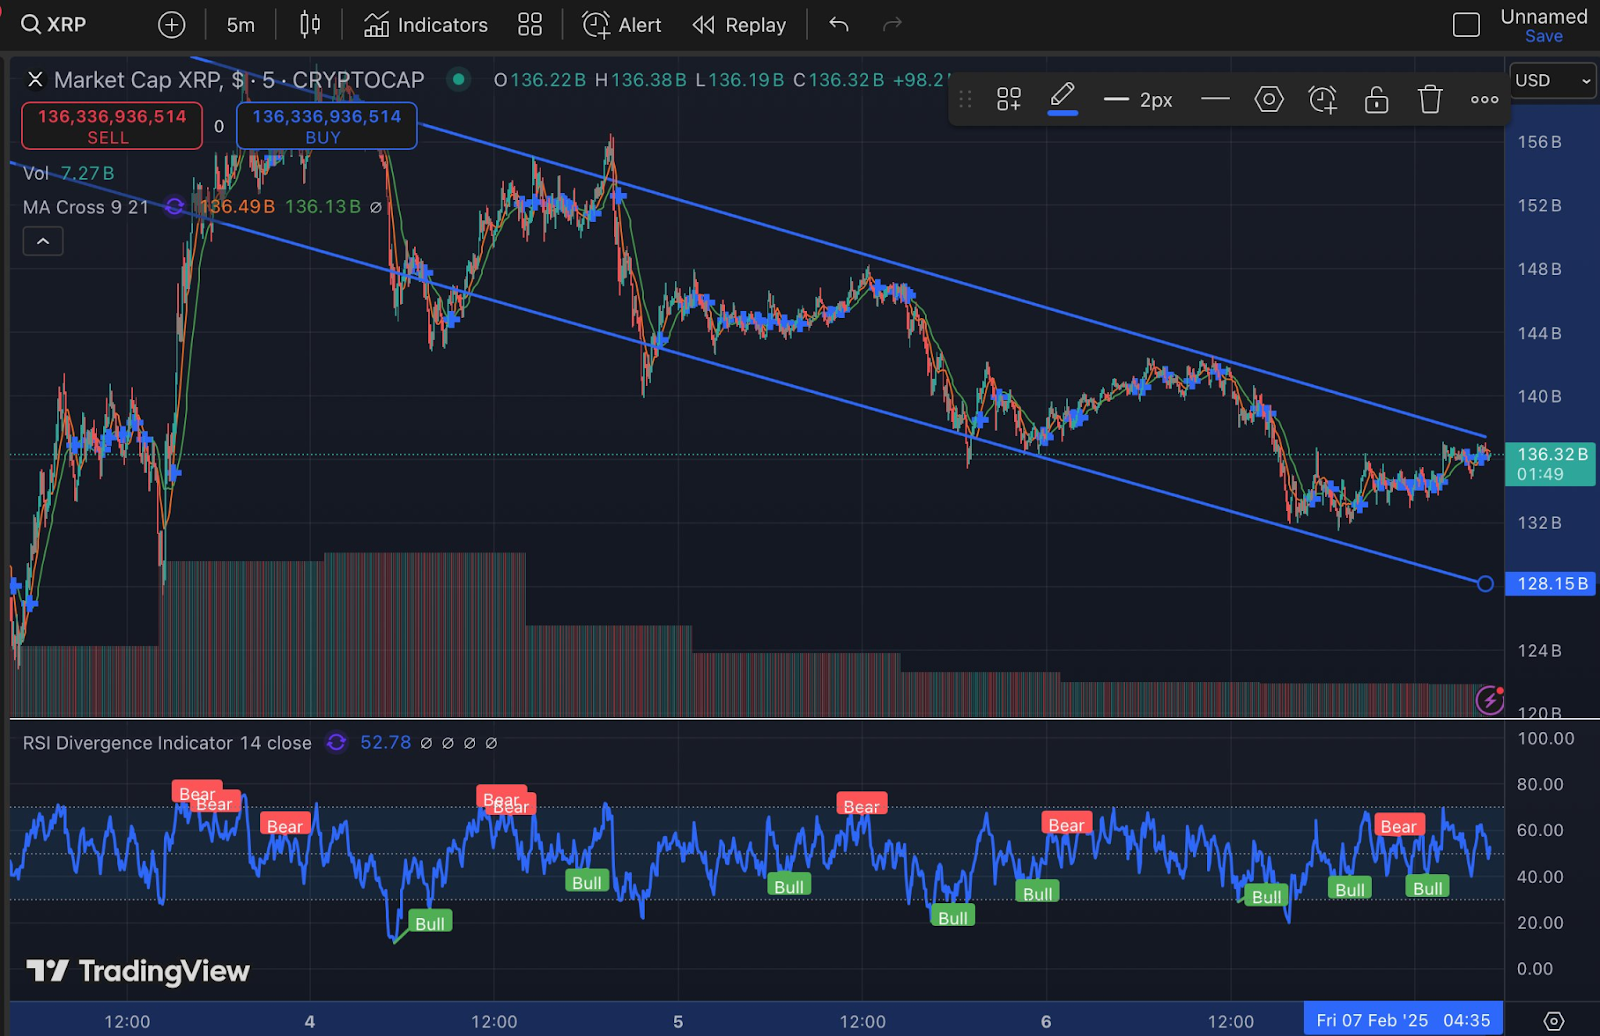
The MA Cross (9,21) shows intersections that mark shifts in momentum. Previous downward crossovers coincided with price declines, while recent movements indicate potential stabilization. The volume bars reflect market activity, with significant spikes during sharp price movements.