
- XRP’s price action shows a hidden bullish divergence, signaling strong buying pressure and a potential breakout.
- Critical support at $0.5500 and resistance at $0.6465 may define XRP’s next major price movement.
- Volume decline hints at potential breakout as accumulation builds, signaling investor confidence in upcoming market moves.
According to crypto analyst JavonTM1, XRP is on the verge of a major price breakout, drawing similarities to its 2017 market movement. The synchronicities displayed in the XRP price action suggest that the cryptocurrency may be entering its final stages of consolidation before a potential upward move.

There is a strong hidden bullish divergence, signaling buying pressure, and increased market momentum. XRP’s current price range and technical indicators suggest that the token might be preparing for a substantial breakout, similar to its historical patterns.
Historical Price Patterns and Hidden Bullish Divergence
Notably, the price action of XRP shows strong similarities to the 2017 cycle. In 2017, XRP entered a consolidation phase before breaking out into an unprecedented rally. A hidden bullish divergence occurred during this period, where despite the sideways price movement, the momentum oscillator reflected increasing buying pressure.
This divergence preceded XRP’s price surge. Fast forward to 2024, and a similar hidden bullish divergence is observed, with the price once again in a consolidation phase. This strong indicator suggests that XRP may soon experience another large upward move, reinforcing the idea of repeating historical patterns.
Key Resistance, Support Zones, and Fibonacci Levels
The key resistance level lies at $0.6465, a previous high that XRP has struggled to break through. The support zones are at $0.5500 and $0.5000, both acting as crucial barriers for XRP during its sideways movement.
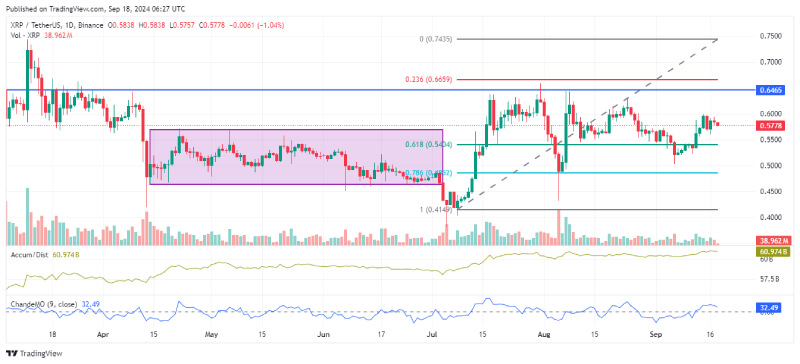
Notably, Fibonacci retracement levels also play a role, with the 0.618 level at $0.5444 acting as strong support. Meanwhile, the 0.236 Fibonacci level at $0.6659 suggests a potential target if XRP manages to break through its resistance.
Volume Trends and Momentum Indicators Signal Market Move
Volume has been declining recently, indicating that a breakout could require a surge in buying activity. The Accumulation/Distribution indicator also shows steady accumulation, suggesting that smart investors are positioning themselves for a potential upward move.
Furthermore, the Chande Momentum Oscillator reveals a phase of momentum weakness. However, this may only signal consolidation before the next price move. The momentum, coupled with low volatility, points to XRP gearing up for a market move, with the market monitoring the support and resistance levels for any signs of a breakout.