- XRP liquidity clusters near $2.30 suggest a major liquidation zone that may guide future price movement.
- Exchange inflows show strong selling pressure as price reacts sharply to increased supply activity.
- Liquidation cycles reveal a leveraged market with repeated shifts between bullish and bearish pressure.
XRP trades within a volatile structure as liquidity patterns, inflow spikes, and leveraged wipeouts shape short-term market behavior. Data shows supply pressure rising while a major liquidation zone builds above current price levels.
Liquidity Concentration Near the $2.30 Region
CW (@CW8900) noted that XRP’s maximum liquidable position sits around $2.30. The liquidity heatmap supports this by showing concentrated bands near $2.25–$2.30. These bright zones represent a dense cluster of liquidable positions above current market levels.
Price activity remains below this region and trades between $2.05 and $2.10. Heatmap layers beneath the market show thinner liquidity, suggesting limited incentive for downside continuation unless new orders accumulate. The lower zones appear swept, indicating prior liquidity has already been absorbed.
The earlier decline from around $2.20 triggered a sweep of lower clusters and left the upper liquidity bands untouched. This structure indicates a possible path toward the $2.30 region if price regains momentum above short-term levels such as $2.15.
Rising XRP Inflows Point to Heavy Supply Pressure
Exchange inflow data between Nov 29 and Dec 07 shows rising activity during price declines. Low inflows at the start of the period kept the price stable above $2.17. Market pressure increased once inflows expanded sharply on Dec 01, reaching around 8M XRP.
This inflow spike aligned with a move toward $2.03, marking the week’s steepest drop. The pattern repeated on Dec 03 when inflows exceeded 14M XRP. The price temporarily touched $2.16 but fell again as selling intensified.
Inflows eased on Dec 04, yet price continued drifting lower from earlier supply-driven weakness. A moderate rise around Dec 05, near 4M XRP, pushed price back toward the $2.03–$2.05 range, reinforcing the direct link between inflows and downward movement.
Leverage Exposure Drives Repeated Liquidation Cycles
The XRP Total Liquidations Chart shows how leveraged positions shifted through November into early December. Large long liquidations occurred around Nov 3–5 as traders anticipated an extended move higher. These events coincided with early price weakness.
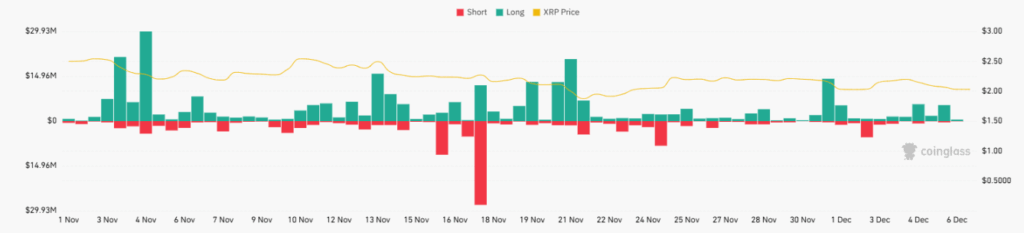
Short traders faced heavy wipeouts around Nov 17–18 when liquidations approached $30M. This move followed a failed breakdown and triggered a sharp reversal that moved against sellers. The size of the liquidation suggests crowded positioning near key support.
Through late November, both long and short liquidations alternated as price fluctuated. Early December saw smaller liquidations, yet long positions continued to unwind near the $2.00–$2.10 zone. This behavior reflected a choppy market where leverage was repeatedly tested.