
- XRP in a nine-year ascending triangle, with long-term structure intact despite recent consolidation near $1.32.
- Analyst flags $0.75–$0.80 as key dip zone aligning with trendline, offering potential buy opportunity if revisited.
- Weak RSI and MACD show low momentum, with resistance near $1.36–$1.38 and support around $1.30 guiding next move.
Analyst Ali outlined a long-term XRP price setup pointing to a potential breakout. He noted XRP continues trading within a nine-year ascending triangle, while current price action near $1.32 shows consolidation after recent volatility, keeping focus on both short-term levels and a deeper support retest.
Long-Term Triangle and Key Support
According to Ali, XRP has followed a consistent pattern since 2017 within an ascending triangle structure. Each rally has reached horizontal resistance before pulling back toward a rising trendline support.
Following the August 2025 rejection, he now tracks a possible move toward the $0.75–$0.80 zone. Notably, this range aligns with the macro trendline and represents a key support area.
He stated this level could act as a “buy the dip” zone if price revisits it. However, the broader structure remains intact as the triangle approaches its apex.
Short-Term Price Action
Meanwhile, at press time, XRP was trading at $1.32 after failing to hold gains near $1.38. Earlier, price rallied from $1.30 to $1.38 with rising volume, indicating strong initial demand.

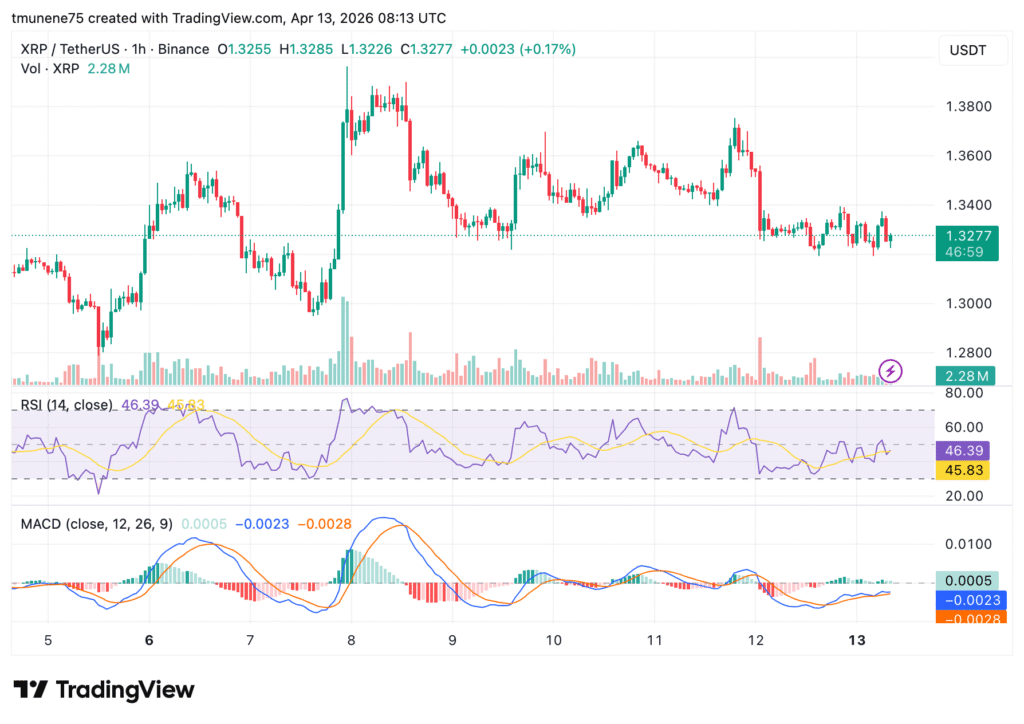
However, momentum faded quickly, leading to a pullback and sideways movement. Since April 9, XRP has traded between $1.32 and $1.36, with repeated resistance near $1.36–$1.38.
A sharp drop on April 12 pushed price back toward $1.33, reinforcing selling pressure at higher levels. As a result, the market remains locked within a narrow range.
Indicators Show Weak Momentum and Indecision
Technical indicators further confirm limited direction. The RSI is near 46, slightly below neutral, indicating mild bearish pressure without oversold conditions.
Meanwhile, the MACD hovers near the zero line with a weak crossover attempt. The small histogram reflects low momentum and lack of strong trend confirmation.
Support is between $1.30 and $1.32, while resistance stands at $1.34–$1.36 and $1.38. A break above resistance could extend gains, while a drop below support may trigger further downside.