
- XRP’s current triangle pattern since 2018 mirrors a bullish structure from 2014-2017, hinting at potential for high volatility.
- Analyst notes a tightening range in XRP’s price action, with historical trends indicating an approaching breakout.
- XRP’s RSI at 44.57 shows mild bearish momentum; a rise or dip could signal a significant move based on consolidation trends.
Analyst JavonTM1 suggests XRP is nearing a breakout moment within a major consolidation phase, possibly resembling a historic bullish trend. He notes that XRP’s price action, mapped by two symmetrical triangle patterns, may signal an imminent breakout or breakdown. The analysis highlights similarities between a past price structure from 2014-2017 and XRP’s current pattern, suggesting potential for high volatility and a decisive move in the near future.
Historical Triangle Patterns and Key Observations
From 2014 to 2017, XRP followed a symmetrical triangle pattern with tightening highs and lows, compressing price movement. Within this formation, XRP saw a false breakdown near the apex, which likely shook out weaker positions before an eventual breakout. This breakout occurred after 107 weekly candles, taking XRP to around $3.26.
A similar consolidation pattern has emerged from 2018, with XRP showing lower highs and higher lows. Notably, another false breakdown within this pattern suggests that a breakout or breakdown could occur soon, possibly mimicking the previous upward trend.
Current Consolidation Pattern and Price Movement
Since 2018, XRP has remained within a second, broader triangle, continuing the lower highs and higher lows pattern, with prices compressing toward an apex. The weekly chart captures around 221 bars, suggesting a multi-year consolidation phase.
The symmetry in these patterns could indicate potential price movement. Resistance and support lines, outlined by both triangles’ boundaries, create a tighter price range as the apex nears. The historical similarity in patterns raises speculation around an upcoming breakout.
Technical Indicators and Short-Term Price Dynamics
At press time, XRP was trading at $0.5244, a slight dip accompanied by an RSI value of 44.57, which leans toward mild bearish momentum. If the RSI dips below 30, XRP may enter oversold territory, attracting buyers.
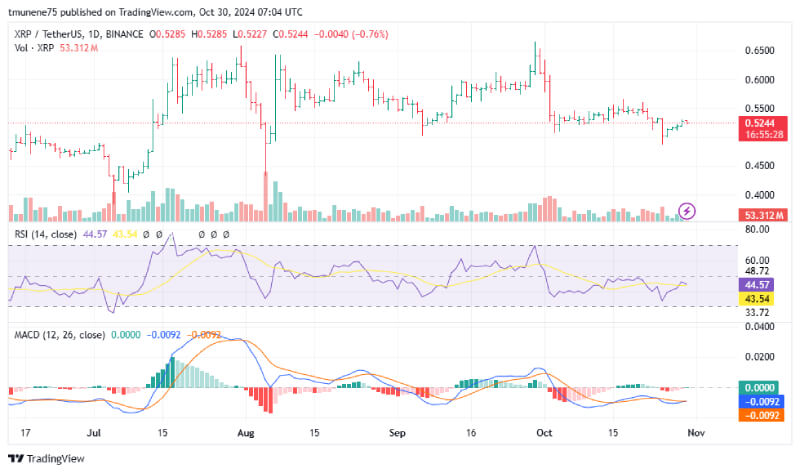
The MACD line, aligned with the signal line, suggests weak momentum, potentially indicating market indecision. A bullish reversal could emerge if the RSI climbs and the MACD shows an upward cross. Short-term scenarios include a continuation of sideways trading or a potential test of the $0.50 support level, depending on indicator movements.