- The $0.25 to $0.30 range held multiple times, with higher highs and higher lows forming after strong rebound and big volume inflows.
- Chart levels highlight $0.5829, $1.1876 and $2.4360 as resistance points, with a projected path to $2.1796 if momentum continues.
- Bitcoinsensus noted a liquidity sweep near $0.20 and identified upside liquidity above $0.62 as the next area of strength.
Large holders have started positioning around Arbitrum following a sharp swing that briefly erased most of its value. The token plunged more than 77% during the recent market crash but then rebounded 238% from the low, a move analysts say shows conviction among buyers.
Crypto Patel noted that the price never closed beneath the $0.25 support, which has now emerged as a repeatedly defended accumulation band. Trading activity around that zone has remained consistent, suggesting interest has not faded despite earlier volatility.
Support Zone is Active
That support range between $0.30 and $0.25 has been described by Patel as the current accumulation area, with price action holding above it several times. The structure now shows higher highs and higher lows forming after the token reclaimed its broader demand zone.
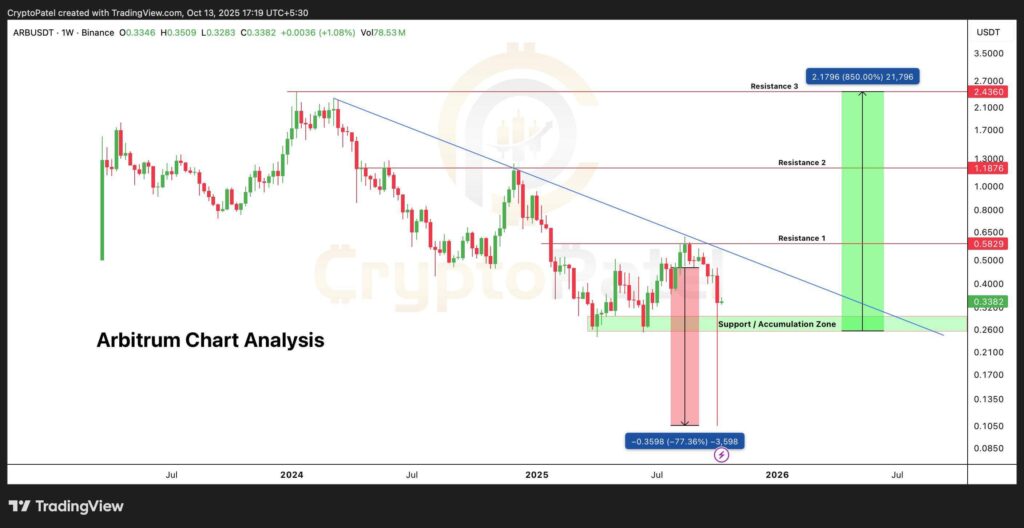
Momentum strengthened during the rebound, and volume inflows accompanied the recovery phase, reinforcing demand at lower levels. Patel also outlined upside targets at $0.58, $1.18, and $2.43 if the structure remains intact.
Technical Structure and Resistance Levels
Chart observations indicate a visible consolidation pocket between $0.26 and $0.33. This area appears to act as a base where long-term buyers positioned during the drop. The broader structure still shows a downtrend that began from mid-2024 highs, with the descending trendline yet to be broken.
Price previously moved from around $0.46 down to roughly $0.10 before stabilizing. A sustained move above that trendline would indicate further recovery attempts. Three resistance levels have been outlined. The first is $0.5829, aligning with the trendline intersection. The second is at $1.1876, where earlier consolidation formed.
The third is $2.4360, which marks a major longer-term resistance area noted by traders. The chart also shows a projected path toward $2.1796, representing an estimated 850% upside if price moves through the first resistance and maintains momentum.
Analyst Notes on Liquidity Levels
Additional commentary from Bitcoinsensus noted a liquidity sweep near $0.20 that preceded the rebound. The group stated that the move cleared downside liquidity before the reversal took place.
Their assessment pointed to liquidity above $0.62, which they identified as the next zone of interest. The recent behavior near $0.33 suggests a reduction in selling pressure, with buyers stepping in at repeated intervals. However, failure to remain above $0.26 could restore downward pressure and break the current structure.