
- A whale’s $PEPE buy signals strong confidence, holding 1.404T tokens with a 328% profit—big moves shape market trends.
- PEPE nears a multi-month support level; if held, it could spark accumulation and bullish momentum. Traders eye key Fibonacci levels.
- RSI at 29.54 signals oversold conditions, while a descending trendline caps price action. A breakout may confirm a bullish reversal.
Massive $PEPE accumulations are shaking the market. A smart whale, identified as “0xe7d,” recently spent 974.642 ETH to buy 280.85 billion $PEPE, totaling $2.62 million. This whale now holds a 1.404 trillion $PEPE, amounting to $13.2 million, with a massive profit of $13.75 million, marking a 328% gain.
Key Support Zone Holds Critical Market Significance
$PEPE is currently trading near a multi-month support zone. This region plays a crucial role in determining the next market direction. If the price holds at this level, it could become a prime accumulation zone for investors. Many traders are eyeing this level as a potential buy opportunity, with some planning to Dollar-Cost Average (DCA) into positions.
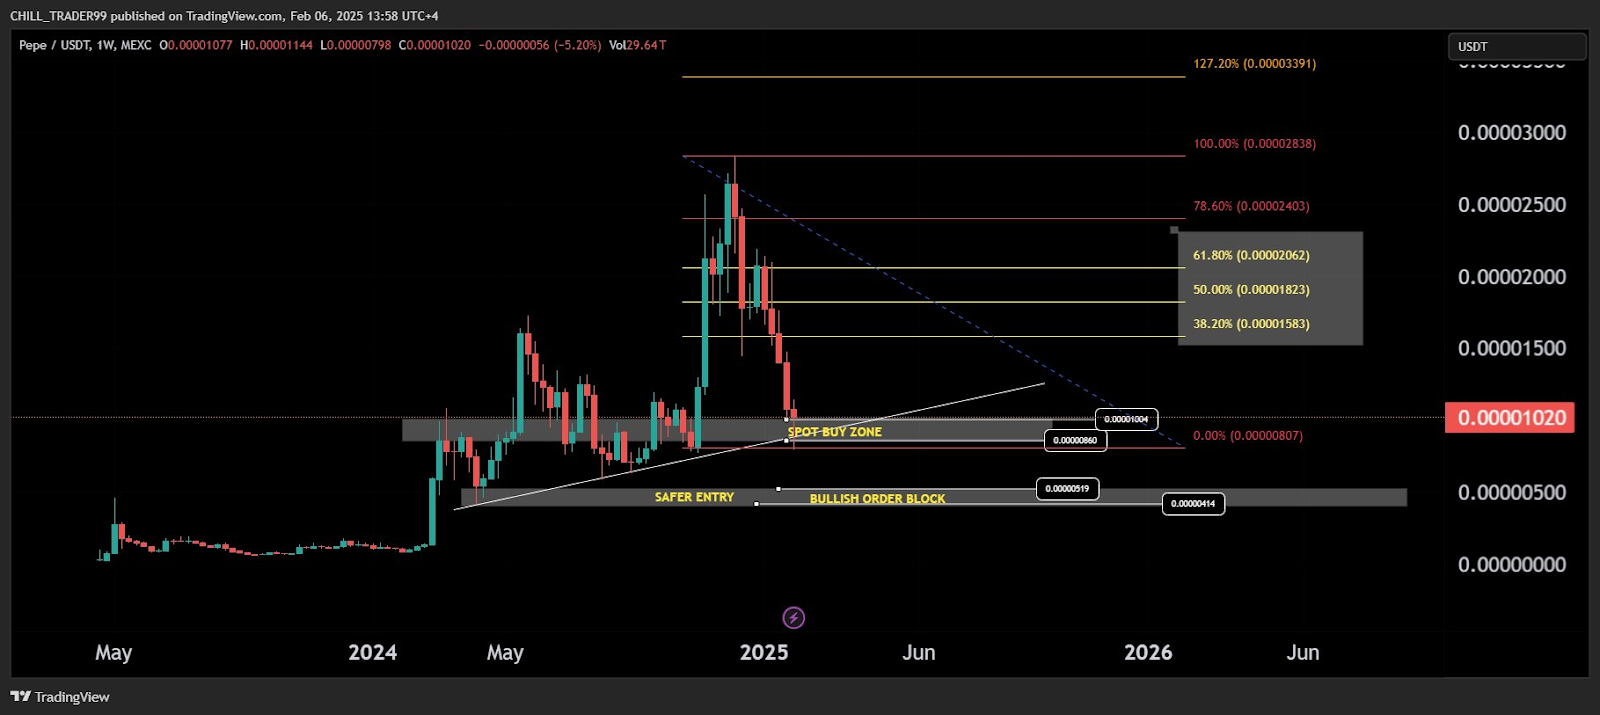
Moreover, Fibonacci retracement levels provide key insights. Resistance levels are positioned at 38.2% (0.00001583), 50% (0.00001823), and 61.8% (0.00002062). These levels could act as barriers to upward price movement. The highest Fibonacci extension level, 127.2% (0.00003391), remains a long-term target for bullish traders.
Price Action and Market Indicators
The price recently dropped into a critical “Spot Buy Zone,” aligning with past consolidation areas. Below this zone, a secondary “Safer Entry” level provides additional support. If further declines occur, the price could enter the “Bullish Order Block” between 0.00000519 and 0.00000414. Historically, this area has supported bullish movements.

A descending trendline continues to act as a dynamic resistance. Breaking above this trendline could confirm a bullish reversal. Meanwhile, current market sentiment remains bearish. The price sits at 0.00001020, marking a 5.20% decline. Trading volume stands at 29.64 trillion PEPE, reflecting ongoing market activity.
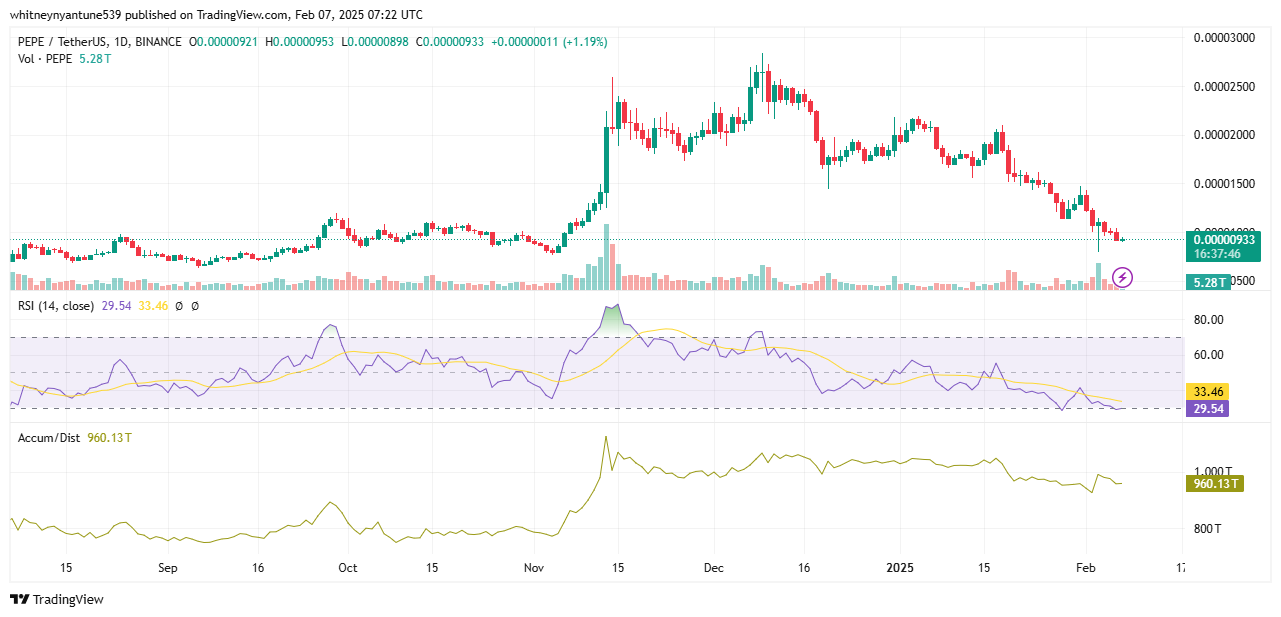
Technical indicators support the bearish trend. The Relative Strength Index (RSI) stands at 29.54, placing it in the oversold zone. The Accumulation/Distribution (A/D) indicator reads 960.13 trillion, showing capital inflows and outflows.