
- A whale offloaded 531.5B PEPE at a $465K loss, signaling fading confidence amid cooling funding rates and bearish price action.
- PEPE’s funding rate dropped to 0.0050% as price declined from May highs, reflecting reduced leverage and weakening bullish momentum.
- Technicals show PEPE stuck in a downtrend with low RSI, shrinking volume, and price hovering near Bollinger Band lows, hinting consolidation.
A whale recently deposited 531.5 billion PEPE, worth $5.06 million, into Binance. According to Spot On Chain, the whale likely accepted a loss of $465,000 after holding the tokens for just one week. This sizable move highlights growing unease in the PEPE market. It follows a sharp price correction and cooling interest from derivatives traders, despite earlier bullish momentum.

From March 30 to June 22, PEPE’s Open Interest-Weighted Funding Rate mostly remained positive. This trend signaled strong net long positions across most intervals. Funding rates peaked mid-May at 0.0300%, aligning with a major PEPE rally. Consequently, prices spiked, gaining over 120% from $0.00000700 to near $0.00001600. However, prices soon reversed, sparking a broad pullback.
Market Sentiment Weakens
April and early May saw negative funding intervals, especially on April 15 and 22. Shorts paid longs during these bearish episodes, with rates dropping to around -0.0100%. However, the rate quickly rebounded to positive territory. By late May, the funding rate stabilized around 0.0050%, suggesting reduced speculative enthusiasm.
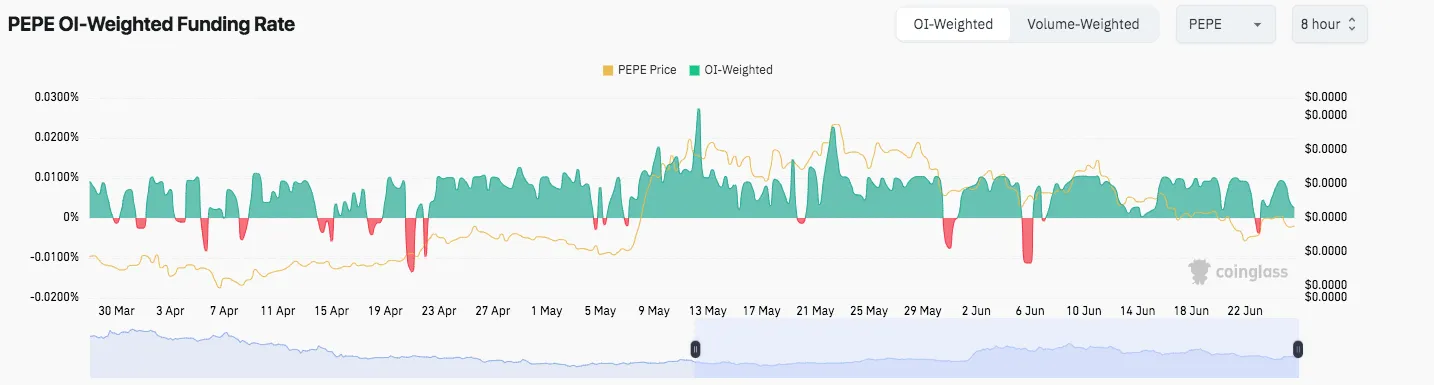
Source: Coinglass
Moreover, both volume-weighted and OI-weighted data confirmed a dominant bullish bias through May. However, the recent rate stability signals a cooling market. This drop in speculative pressure coincided with PEPE’s sharp decline from its May highs.
Technical Indicators Show Consolidation
PEPE now trades at $0.00000938 on Binance, down 1.57% in the latest 4-hour candle. The price reached a daily high of $0.00000959 and low of $0.00000932. A descending trendline has controlled price action since late May, consistently rejecting upward movements.
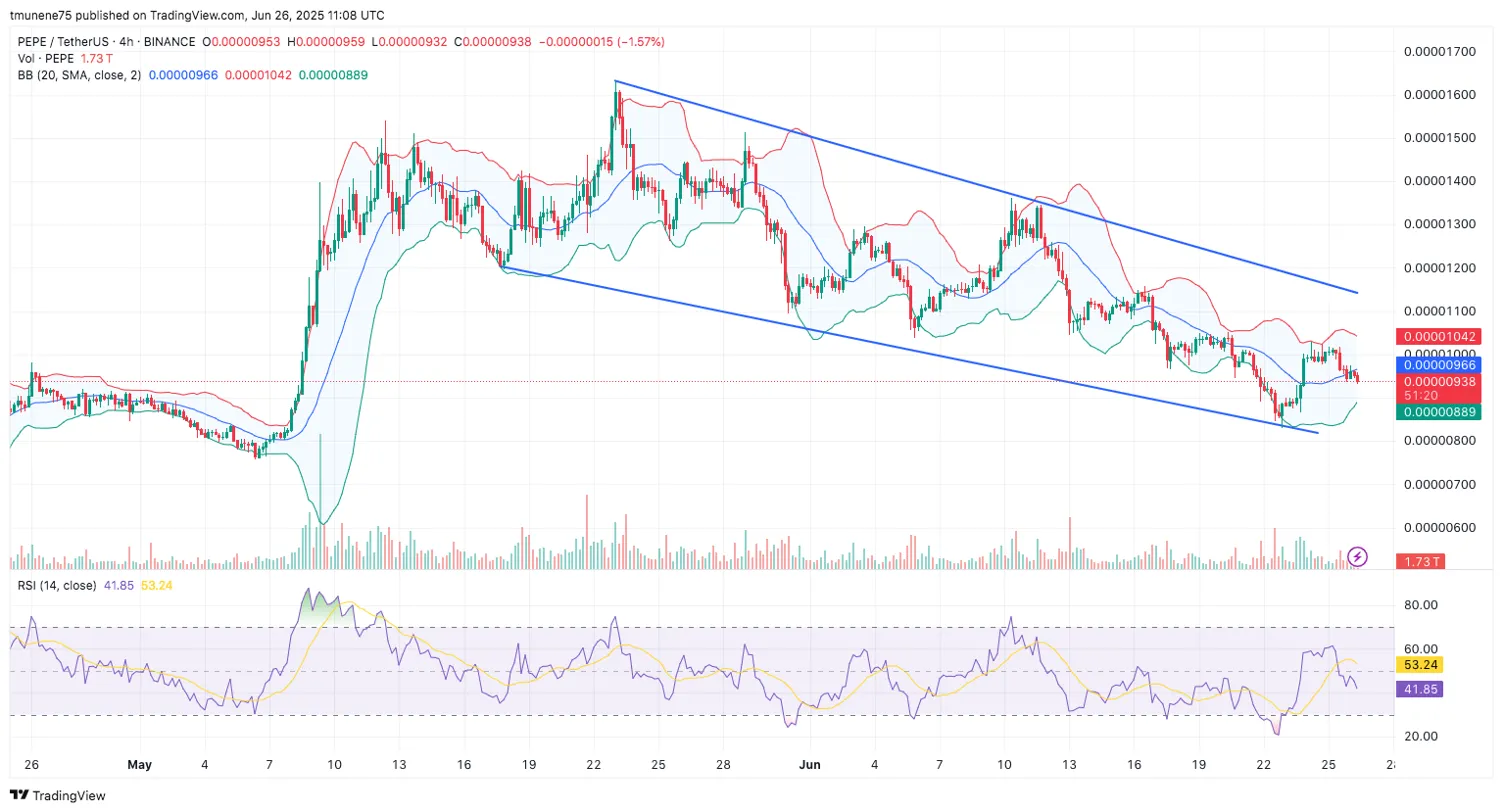
Source: TradingView
Additionally, Bollinger Bands show compression, with the upper band at $0.00001042 and the lower band at $0.00000889. This indicates limited volatility. The middle band sits at $0.00000966, with price now near the lower band—signaling possible oversold conditions.
RSI reads 41.85, which remains below neutral 50. This confirms lingering bearish momentum. At 1.731 million, trading volume is lower than the peaks observed during the volatility of May. The market’s waning speculative appetite is further supported by this volume reduction.