
- VIRTUAL breaks a falling wedge on the 4H chart as technical pressure builds near key resistance zones.
- Liquidation spikes show long-side vulnerability during sharp declines, signaling crowded bullish positioning.
- Price rebounds toward $0.96 as liquidation patterns shift and short positions begin to unwind gradually.
VIRTUAL moves into a decisive phase as price strength emerges after a falling-wedge breakout and shifting liquidation patterns. The market shows renewed momentum while traders adjust positions following recent volatility and concentrated liquidation clusters.
Breakout Structure Forms on the 4H Chart
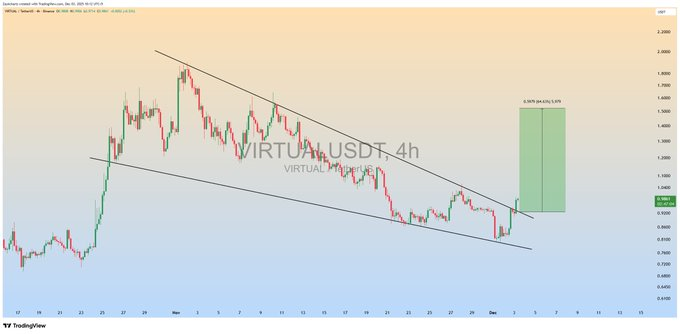
VIRTUAL shows a clean falling-wedge breakout on the 4-hour chart, forming after several weeks of compression. Price traded within a narrowing channel of lower highs and lower lows before approaching the wedge apex. The formation reflects a controlled decline rather than aggressive selling.
The breakout candle pushes above the descending resistance with clear strength. ZAYK Charts noted this breakout and suggested the pattern may support a fresh upward wave. The move aligns with the measured breakout structure often seen when sellers lose momentum.
Source: X
A green projection box on the chart shows an upside target near 43.96%. This target reflects a common extension drawn from the wedge’s height. It also aligns with a prior consolidation band that may attract price as momentum develops.
VIRTUAL Price Gains and Market Response
VIRTUAL as of writing, trades near $0.9593 after rising 14.69% in the past 24 hours. The asset also posts a 5.59% weekly gain. The move follows a period of broader market pressure that kept the price contained within the wedge.
Shorter candles near the wedge base indicated slowing seller momentum before the breakout. The bounce from lower support produced a stronger reaction compared to earlier tests. That behavior often appears when buyers regain control within a contracting pattern.
Volume data is not included in the imagery, yet the breakout candle suggests an increase in participation. Breakouts of this nature frequently draw interest from momentum traders as short positions exit and new entries form above resistance.
Liquidation Patterns Show a Shift in Trader Positioning
Liquidation data reflects strong long-side pressure during earlier declines. A major spike on November 21 shows a large cluster of long liquidations as price moved sharply lower. This event suggests that traders were positioned aggressively for upside during a weakening trend.
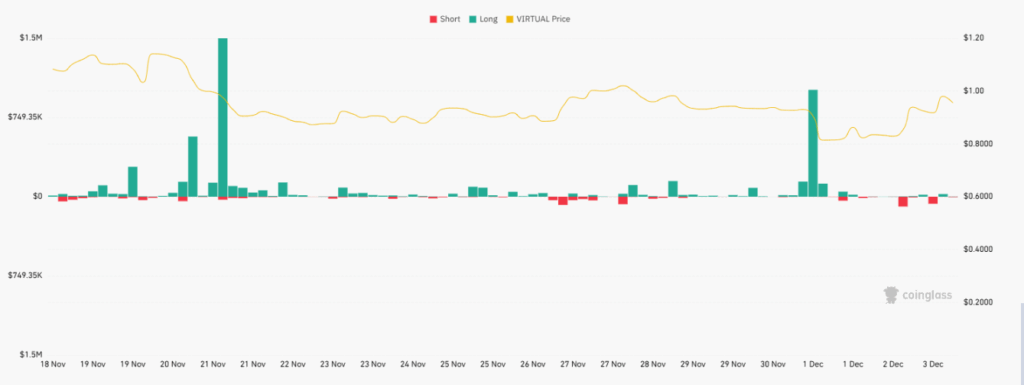
Additional long liquidations appear around December 1 during another downward move. These events point to early bullish entries that failed as the price continued lower within the wedge. The size of these liquidations indicates heavy long-side leverage during corrections.
Toward the end of the chart, short liquidations begin to rise as long liquidations decrease. This shift coincides with the price recovery toward the breakout zone. Short traders expecting continued downside face pressure as momentum returns, producing small yet consistent short liquidations.