
- VeChain (VET) forms a symmetrical triangle over 1,211 days, hinting at a potential breakout in the cryptocurrency market.
- The $0.02306 level acts as a critical support for VeChain, with potential buying opportunities in the demand zone below.
- VeChain shows midweek volatility, stabilizing at $0.0232. Breakout from symmetrical triangle could lead to major price shifts.
Crypto analyst CryptoBusy on X recently highlighted a bullish pattern forming in the VeChain (VET) chart. The current weekly time frame reveals a symmetrical triangle, suggesting a potential pivotal moment in the cryptocurrency’s price movement.
This pattern, spanning 173 bars and covering 1,211 days, reflects a long-term consolidation that could precede a market shift. With a trading volume of 876.361 billion units, this development is essential to monitor, especially as the market near a potential breakout.
Analysis of Support and Resistance Levels
Notable support and resistance levels are evident in the chart. For example, a horizontal line near the $0.02306 level suggests a critical support zone where the price has previously bounced. Additionally, a shaded area beneath the price action could represent a demand zone or another support level.
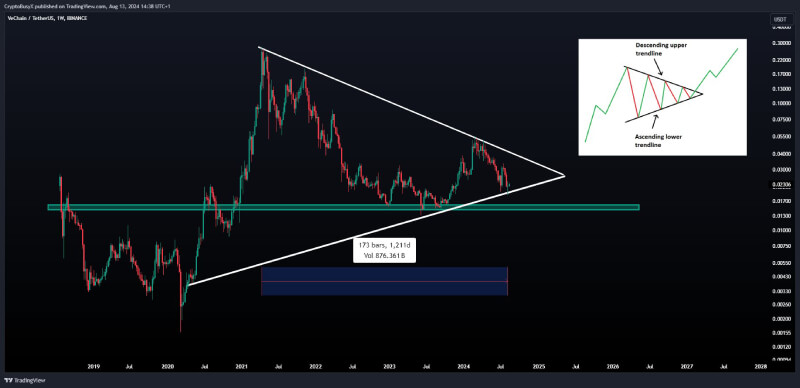
Source: CryptoBusy on X
If the price breaches the upper trendline, it may signal a potential upward move supported by the general market sentiment towards VeChain. However, a breakdown below the lower trendline could lead to further declines, potentially testing lower support levels or entering the shaded demand zone.
Seven-Day Price Chart Overview
The seven-day price chart provides a week of notable volatility. During this period, the price fluctuates between approximately $0.0215 and $0.0240 USD. On August 8th, the price starts around $0.02306 and experiences a sharp decline, reaching a low of about $0.0220 on the same day, indicating strong selling pressure. Following this decline, the price recovers and trends upward, peaking at around $0.0240 on August 11th, showcasing a period of buying interest pushing the price to its weekly high.
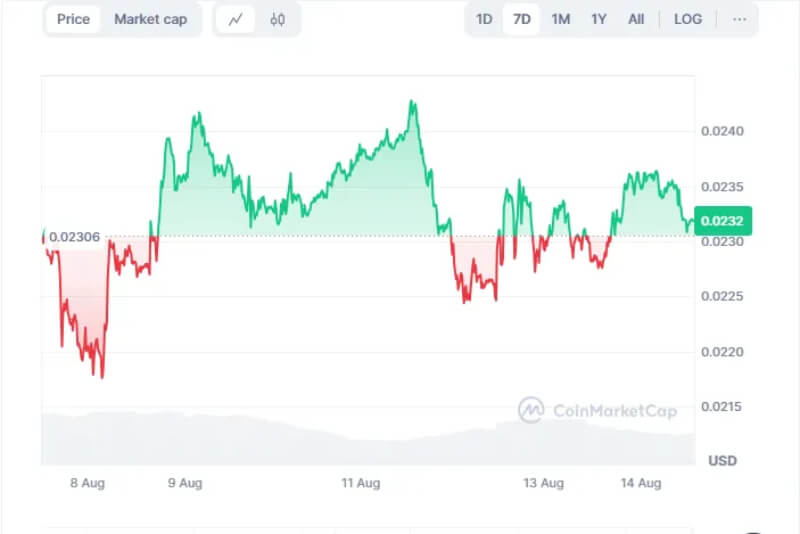
Source: CoinMarketCap
The chart also exhibits midweek volatility, with noticeable fluctuations between $0.0230 and $0.0240 from August 11th to 13th, reflecting trader uncertainty. Toward the end of the week, the price stabilizes around the $0.0232 mark, suggesting a temporary equilibrium between supply and demand.