
- VeChain (VET) approaches a pivotal point with a potential breakout, currently trading at 0.02446 USDT.
- Key resistance at 0.03500 USDT and support between 0.02000 and 0.02500 USDT indicate critical levels for VET.
- VeChain’s new partnership with CCRI aims to align with MiCA regulations, emphasizing sustainability in the crypto industry.
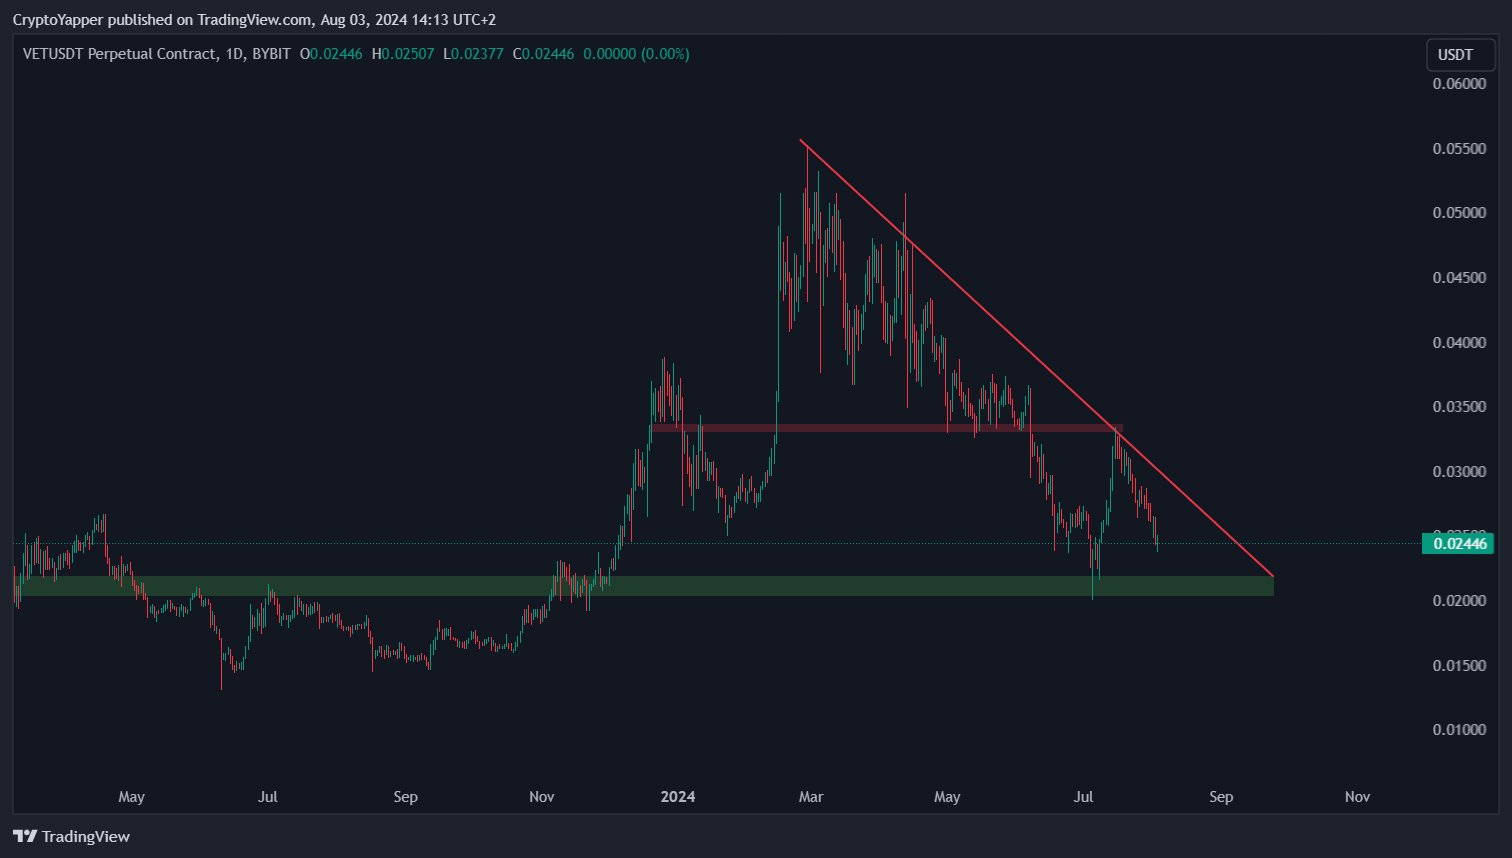
@CryptoYapper on X has noted a potential breakout for VeChain (VET). The VET/USDT daily chart suggests the price may be approaching a pivotal point. Currently, VET is trading at 0.02446 USDT, showing a clear downtrend since April 2024. Notably, a descending red trend line highlights the bearish momentum.
However, a crucial support zone between 0.02000 and 0.02500 USDT indicates a strong price floor. The market should watch for a breakout above the descending trend line, which could signal a reversal, targeting 0.03500 USDT.
Analysis of Key Levels and Trends
The VET/USDT chart shows notable resistance at 0.03500 USDT, a previous support level now acting as a barrier. Volume and volatility, while not displayed, are inferred to be high given the sharp price movements.
If the price breaks the descending trend line, increased volume and a move above 0.03500 USDT would confirm a bullish reversal. Conversely, a drop below the support zone could lead to further declines.
Source: CryptoYapper on X
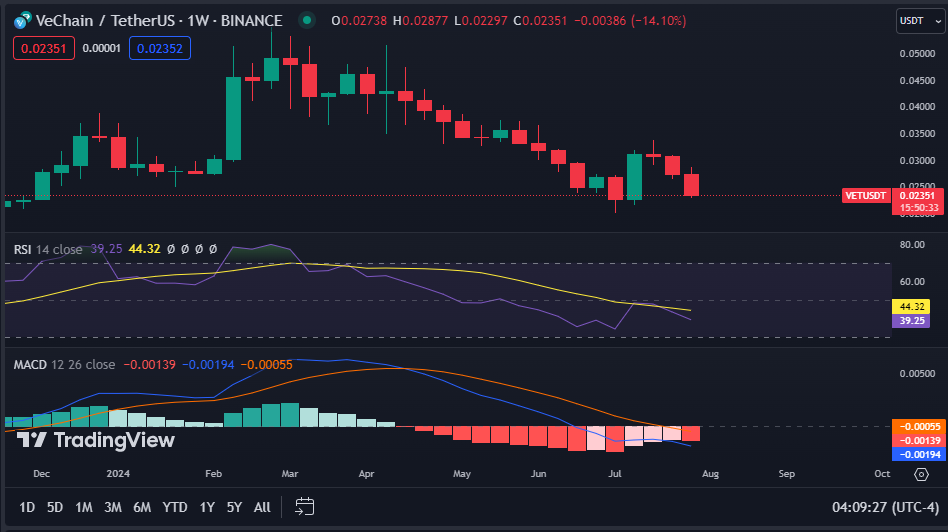
On the weekly chart for VET/USDT on Binance, additional technical indicators such as RSI and MACD provide further insights. Currently, VET trades at 0.02351 USDT. Recent weeks show a 14.10% drop, highlighting the bearish trend.
Weekly candlesticks predominantly display red, indicating selling pressure. The RSI at 44.32 suggests bearish momentum, though it is not yet in oversold territory.
RSI and MACD Indicators: A Closer Look
The MACD, with a line at -0.00194 and a signal line at -0.00139, confirms the bearish trend. However, the histogram shows lighter negative bars, hinting at a potential reduction in selling pressure.
Key observations include immediate support around 0.02200 USDT and resistance near 0.03000 USDT. Volume analysis reveals lower trading activity during price declines, indicating less conviction behind the selling pressure.
Source: TradingView
If the price finds support around 0.02200 USDT and the RSI rises above 50, a potential upward move could occur. A MACD crossover above the signal line would further confirm bullish momentum. However, continued declines below 0.02200 USDT, sustained RSI below 50, and a widening MACD-signal line gap would suggest ongoing bearish pressure.
Recent Partnership Boosts VeChain’s Prospects
VeChain recently announced a partnership with the Crypto Carbon Ratings Institute (CCRI). This collaboration aims to align the VeChainThor blockchain with upcoming MiCA (Markets in Crypto-Assets) regulations in Europe, emphasizing sustainability indicators. These regulations are crucial for integrating digital assets and blockchain services across Europe, affecting businesses and daily life.
VeChain’s current technical indicators suggest bearish momentum with potential support around 0.02200 USDT. The recent partnership with CCRI may boost VeChain’s prospects, aligning with European sustainability regulations. Monitoring key support and resistance levels will be crucial for anticipating future price movements.