
- The drop in USDT dominance hints that traders are pulling money out of stables and putting it back into Bitcoin and alts.
- History shows stablecoin dominance peaks during fear, while breakdowns often kickstart fresh bullish moves across the crypto market.
- With dominance now near 3.70 percent, fading demand for stables signals renewed confidence in risk assets and a possible rally ahead.
The crypto market may be preparing for its next explosive phase as USDT dominance shows signs of rolling over. According to analyst Merlijn The Trader, the stablecoin metric is forming a textbook descending triangle, often seen before breakdowns. This shift suggests money could be leaving stablecoins and flowing back into Bitcoin and altcoins, potentially igniting the next market rally.

Triangle Patterns Highlight Market Shifts
The long-term chart of USDT dominance from 2019 to 2026 reveals multiple triangle patterns shaping investor behavior. Dominance remained modest in 2019 at 1.50% to 2.30%. Nonetheless, the metric increased significantly toward 4.50% by 2020.
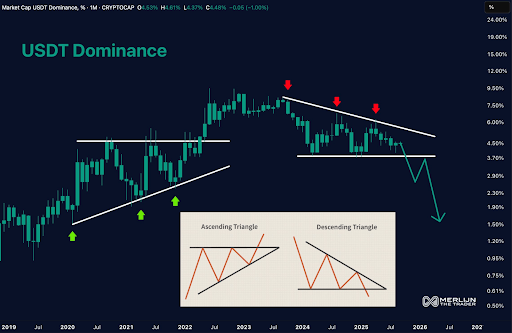
An ascending triangle formed during 2021 as dominance formed higher lows and continuously tested resistance levels.Green arrows marked bullish attempts, showing investor preference for stablecoins during volatile cycles. This uptrend climaxed in mid-2022, when dominance spiked above 9.50%, its highest level, reflecting extreme risk aversion during crypto turmoil.
However, the picture changed in 2023 as dominance entered a descending triangle. Repeated rejections at declining resistance levels highlighted weakening momentum.
Red arrows captured these failures, while stable support at 6.00% maintained the structure. By late 2024, the pattern broke down sharply, sending dominance below 3.70% in months.
Current Levels Show Bearish Pressure
As of 2025, USDT dominance trades near 3.70%, far below its 2022 highs. Market cap data shows current levels at 4.53% with short-term fluctuations across timeframes. The one-hour chart reflects 4.61%, while four-hour data shows 4.37%. Daily figures recorded 4.48%, slightly down by 0.05 points.
Moreover, technical analysis suggests dominance declines usually align with bullish crypto phases. Stablecoins attract inflows during fear-driven markets. Conversely, when confidence returns, capital exits stables and fuels rallies in Bitcoin and altcoins.
Additionally, visual inserts explain triangle mechanics. Ascending triangles often indicate bullish continuation, while descending triangles warn of bearish moves. In this case, the descending structure favors continued downside in dominance.
A confirmed decline in USDT dominance could mark the start of a strong crypto uptrend, pushing Bitcoin and altcoins into a new growth phase.