
- TRUMPUSDT trades near key support, with a descending trendline acting as resistance. A breakout could signal a bullish reversal.
- Price consolidation continues as volume declines. A strong move depends on whether buyers or sellers gain momentum.
- Bulls need to reclaim 22.714 for further upside, while failure to hold support at 15.867 may trigger more downside pressure.
Crypto analyst Lucky chart shows TRUMPUSDT’s price action on Bybit with volatility in recent sessions. The 15-minute chart highlights crucial support and resistance zones. The market opened at 18.846, reaching a high of 18.934 before pulling back to a low of 18.656. Currently, the price sits at 18.868, with a trading volume of 720.16K.

A strong breakout on February 14 led to a sharp rally, pushing the price beyond key resistance. However, a downtrend followed, creating a descending trendline that continued to pressure the price. The data suggests price consolidation near a critical support zone, which could determine the next major move.
Critical Support and Resistance Levels
A previously established resistance level has turned into support after a successful breakout. The price retested this level before attempting another upward move. For purchasers attempting to defend the price, the support zone around 15.867 is still very important. Bulls also need to overcome the resistance level of 22.714 in order to gain more upward momentum.
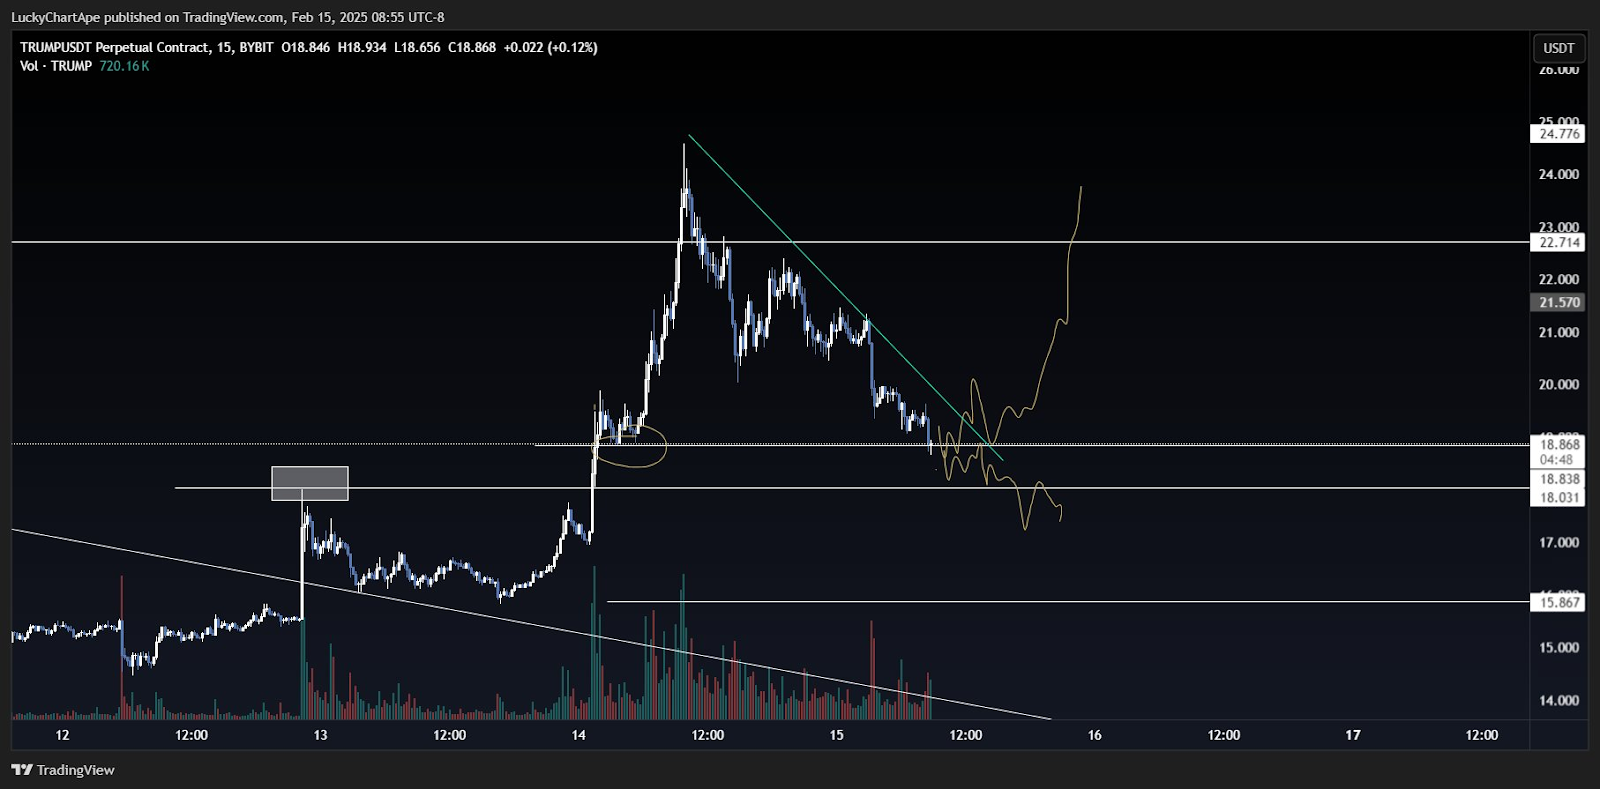
Additionally, a declining trendline is still serving as resistance. A bullish turnaround might be confirmed with a breakout over this level. However, if support is not maintained, additional downward pressure could result. The volume trend indicates decreasing participation, suggesting potential consolidation before a significant move.
Possible Market Scenarios
The projected price movement outlines two potential paths. A short-term decline may occur before an eventual breakout above the descending trendline. If buyers regain control, TRUMPUSDT could rally toward 22.714 and possibly 24.776. Conversely, if selling pressure intensifies, the price may drop toward the demand zone at 15.867.
Furthermore, the volume profile remains a key factor in determining the next market move. A breakout with strong volume could confirm bullish strength. However, low volume may lead to extended consolidation. Traders are closely monitoring these levels for signs of market direction.