
- TRUMP token lost nearly 95% from its ATH as descending resistance rejected every recovery attempt.
- Former support zones turned into firm resistance, confirming fading demand and buyer exhaustion.
- Market cap volatility signals event-driven trading rather than sustained investor participation.
The TRUMP memecoin collapse has become a case study in narrative-driven markets losing structural support. Price action and market cap data show prolonged distribution, weak recovery attempts, and declining conviction among participants.
Prolonged Downtrend Signals Structural Weakness
Price action since the peak reflects a consistent pattern of lower highs and lower lows. The descending trendline has acted as resistance across multiple rally attempts. Each rebound stalled near the same technical boundary.
Former support levels around $37, $16, and $7.3 later became firm resistance. These zones accelerated selling pressure once broken. This behavior indicates demand contraction rather than temporary consolidation.
Market observers on X described the move as controlled distribution rather than panic selling. Several tweets noted that the price failed to hold recovery levels despite short-term buying interest. These reactions framed the decline as structural rather than cyclical.
The latest breakdown pushed the token into fresh lows without a sustained bounce. Thin liquidity amplified the decline. Late buyers absorbed selling pressure from early entrants exiting positions.
Narrative Dependence and Market Psychology
The project lacked roadmap development, protocol utility, and revenue mechanisms. Its valuation relied almost entirely on symbolic appeal and speculative attention. Once that attention weakened, price support eroded.
Psychological patterns mirror earlier memecoin cycles. Early participants realized gains during periods of strong visibility. Late entrants purchased during peak enthusiasm and became exit liquidity.
Volume data later shifted from panic to indifference. Trading activity flattened, suggesting that sellers had already exited. Buyers showed limited willingness to accumulate at lower levels.
This shift from emotional trading to apathy is often associated with post-mania normalization. Price movements became reactive to headlines rather than adoption metrics. The market remained sensitive to short-term catalysts.
Market Capitalization Shows Fragile Balance
Market cap charts reveal gradual distribution before sudden volatility. From late January, capitalization slipped from near $960 million toward $900 million. The movement suggested steady exits rather than abrupt liquidation.
A brief spike toward $1 billion followed, likely driven by event-related speculation. Analysts on social platforms labeled it a reflex rally. The failure to hold higher levels reinforced the absence of long-term inflows.
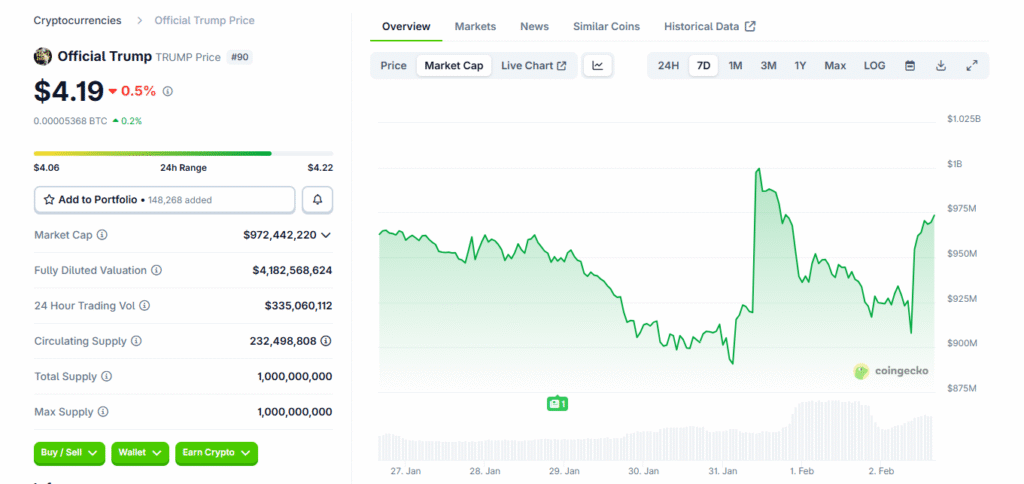
Subsequent sessions showed choppy movement with expanding volatility. Buyers attempted to defend symbolic thresholds. Sellers used each rebound to reduce exposure.
A dip toward $915 million was followed by a rapid rebound. This bounce reflected short-covering and tactical trading. It did not establish a durable base.
The market cap now sits in a zone of uncertainty. Capital remains present but lacks directional conviction. Without renewed narrative strength or structural demand, stability remains fragile.