
- Trader 0xFa5D flipped short on ETH with $15.66M and 10x leverage after a $3.55M loss, reflecting intense market volatility.
- Hedge funds maintain heavy ETH short exposure above $150K despite price recovery, setting the stage for a potential short squeeze.
- Ethereum forms an ascending triangle with bullish MACD signals, indicating a breakout above $2,700 could drive prices toward $4,200.
A well-known trader, identified as 0xFa5D, exited a massive Ethereum ($ETH) long position with a $3.55 million loss. According to Lookonchain, he then deposited the full $15.66 million USDC balance back into Hyperliquid. Just two hours later, he returned with a bold move—flipping short on ETH using 10x leverage. This pivot reveals high conviction despite the earlier loss, reflecting the intensifying volatility in Ethereum markets. This action comes amid rising institutional bearish bets.

Hedge Funds Load Up on Shorts Amid Rising ETH Prices
Hedge funds have been accumulating leveraged short bets for the last four years, according to data from CME Ethereum futures. Ethereum had a sharp increase in short positions as it dropped from $4,800 in late 2021 to values below $1,000 in 2022. But by mid-2024, prices had risen above $4,000, but hedge funds remained pessimistic.
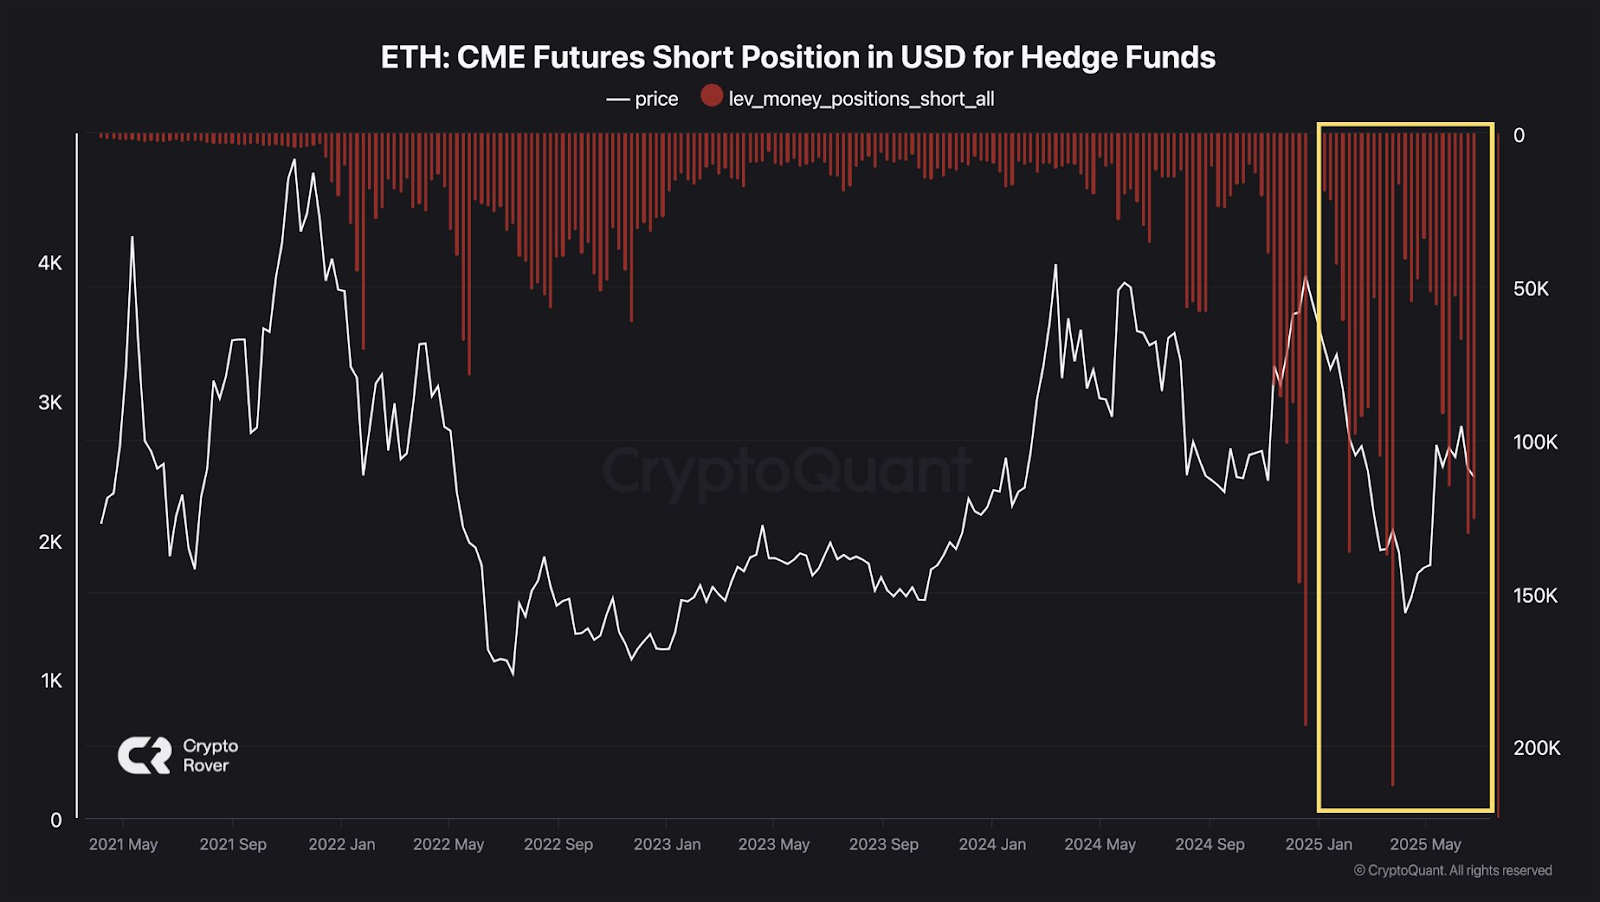
Source: Crypto Rover
Throughout late 2024, Ethereum dropped from $4,000 to nearly $2,000. Short exposure ballooned further, reaching levels above 200K USD. By early 2025, despite Ethereum recovering above $3,000, short positions remained elevated..
Technical Indicators Show Bullish Ethereum Setup
Since March 2025, Ethereum has been building an ascending triangle pattern, according to CryptoGEMS. Higher lows of $1,800, $2,000, and $2,200 have been reached by the price. In the meantime, there have been several tests of the resistance level at $2,700.
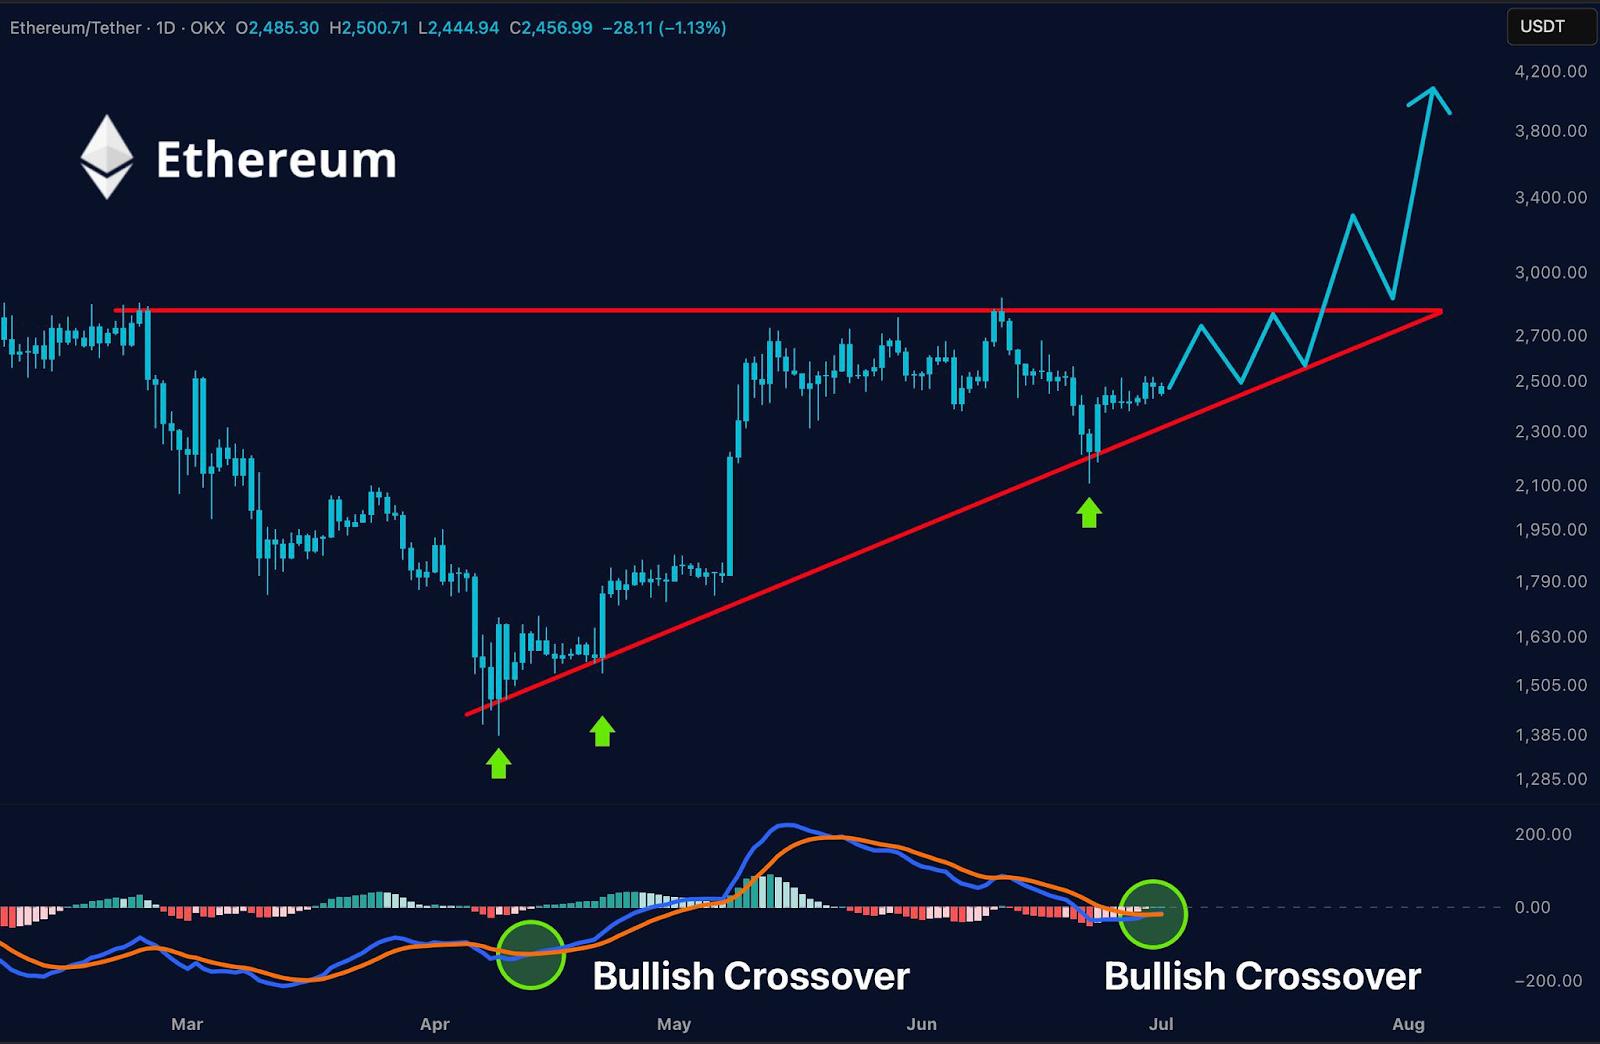
Source: Crypto GEMs
Additionally, the MACD displays two bullish crossovers: one in late June and one in April. Since each crossover led to a significant recovery, buyers seem to be in control of the market right now.
As a result, Ethereum’s anticipated trajectory indicates a breakout above $2,700, with potential upward objectives ranging from $3,800 to $4,200. The stair-step pattern is a reflection of past bullish breakout activity. Furthermore, Ethereum maintaining above the rising trendline indicates potential gains.