- A $2M SOL long trade with 3x leverage signals market optimism despite recent volatility, with key support near $150.
- SOL trades within a downward channel but could rebound from key support, targeting resistance levels at $190.417 and $292.842.
- HYPE faces resistance in a symmetrical triangle; a breakout or breakdown could determine its next major price movement.
A trader recently deposited $2 million USDC into Hyperliquid and opened a long position on SOL with 3x leverage. The entry price was $142.54, with a liquidation price of $97.45. This move signals confidence in SOL’s upward potential despite recent price volatility. Investors are watching closely to see if SOL can maintain its support and push higher.
SOL Eyes Key Support for Potential Rally
Currently, SOL trades at $155.619, reflecting a 7.31% decline. A key support zone of $150 remains crucial. Previously, the price rebounded from this level, triggering a strong rally. If SOL follows a similar pattern, a bullish move could emerge.
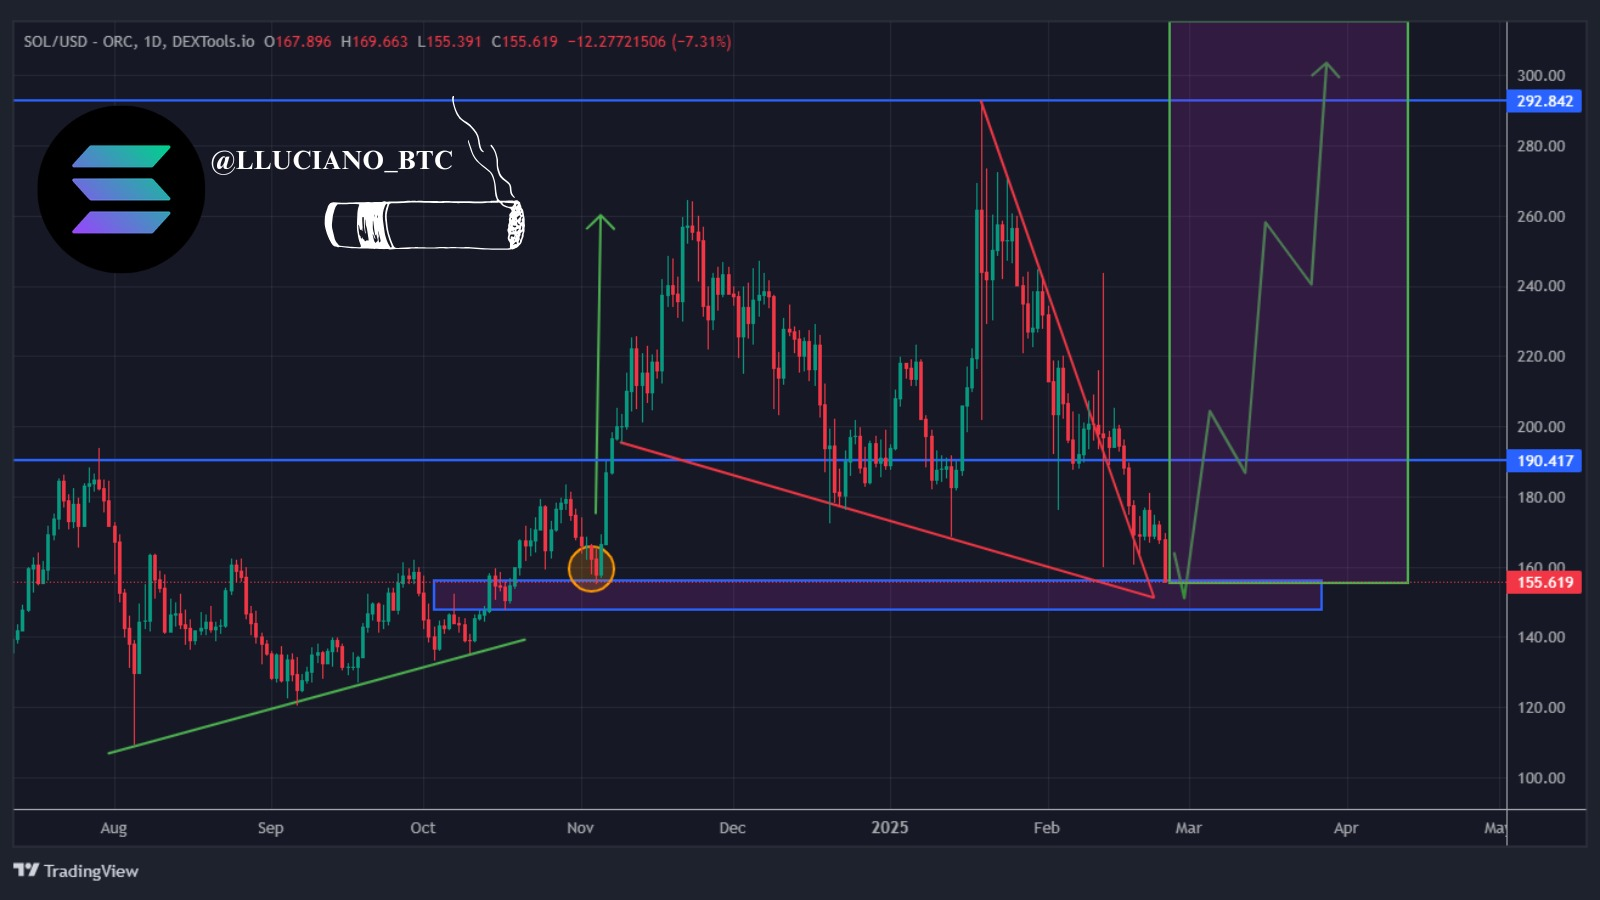
A descending red trendline marks the recent bearish phase. The price follows a downward channel but approaches the critical support level. If the pattern repeats, SOL could bounce off this region and target higher resistance levels.
Resistance levels stand at $190.417 and $292.842, indicating potential upward targets. A green projected path outlines possible price movements, showing expected retracements before SOL ascends. The purple-shaded area highlights a bullish scenario aiming for the $292.842 resistance.
Moreover, a past strong bounce from this support zone strengthens bullish sentiment. A notable reaction point, marked by an orange circle, suggests a possible reversal. Additionally, an earlier ascending trendline on the left side indicates previous bullish momentum before the recent decline.
Hyperliquid (HYPE) Breakout Faces Resistance
HYPE is attempting a breakout, potentially targeting $13. Currently, it trades at $23.31, showing a 1.91% decline. A symmetrical triangle pattern suggests price consolidation before a decisive move.
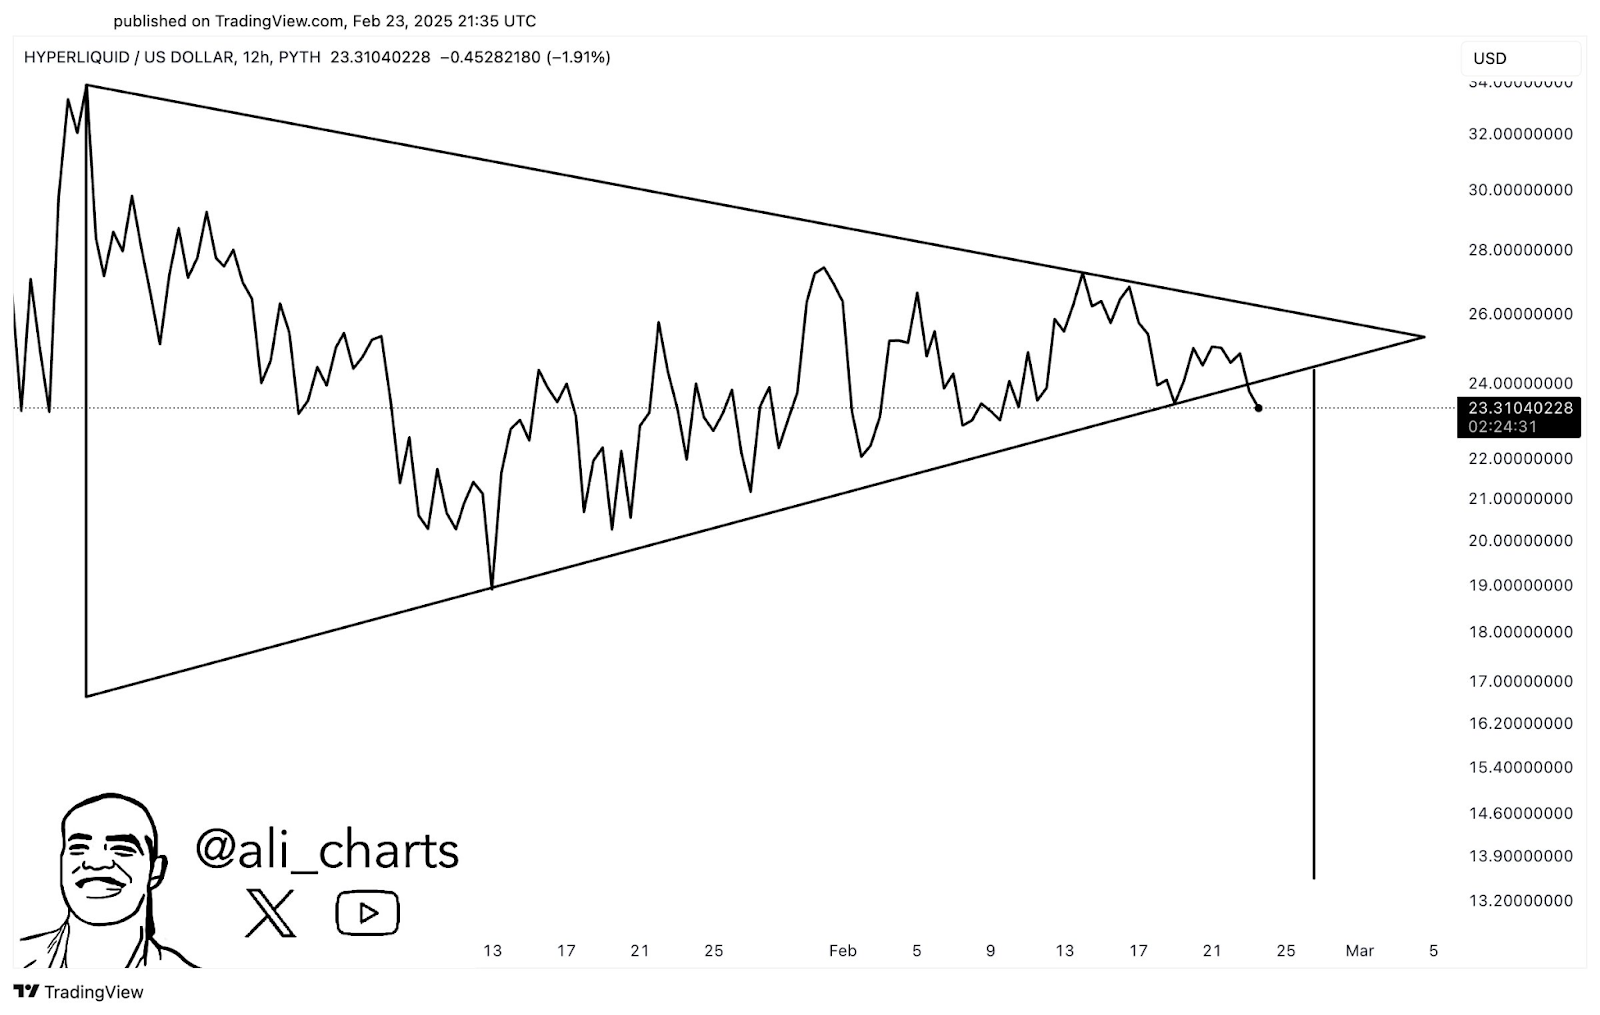
The upper trendline connects lower highs, signaling selling pressure. Meanwhile, the lower trendline supports higher lows, showing buyer activity. The price recently touched the lower boundary, suggesting a possible breakdown.
Volume remains unclear, but the tightening range suggests a breakout is imminent. If the pattern breaks down, a price drop could follow. A downward projection suggests a move below $14 if sellers gain control.
Resistance remains strong above $26, while support holds above $22. A confirmed breakdown could lead to a retest of lower levels near $18. Market participants remain cautious as price action tightens, signaling potential volatility.