
- Crypto market retests key support after breaking 2021 highs, signaling potential continuation if trendline holds.
- Altcoin market structure mirrors past cycles, with a rounding bottom formation hinting at a new expansion phase.
- Historical patterns suggest a bullish breakout could follow consolidation, reinforcing market strength.
As per analyst Moustache analysis, the cryptocurrency market is at a critical juncture as total market capitalization undergoes a retest. The market previously broke its 2021 all-time high before retracing to confirm support. Currently, the price action is testing a long-term ascending trendline. Besides, the structure suggests a continuation of the bullish trend if support holds. However, a breakdown could shift market momentum.
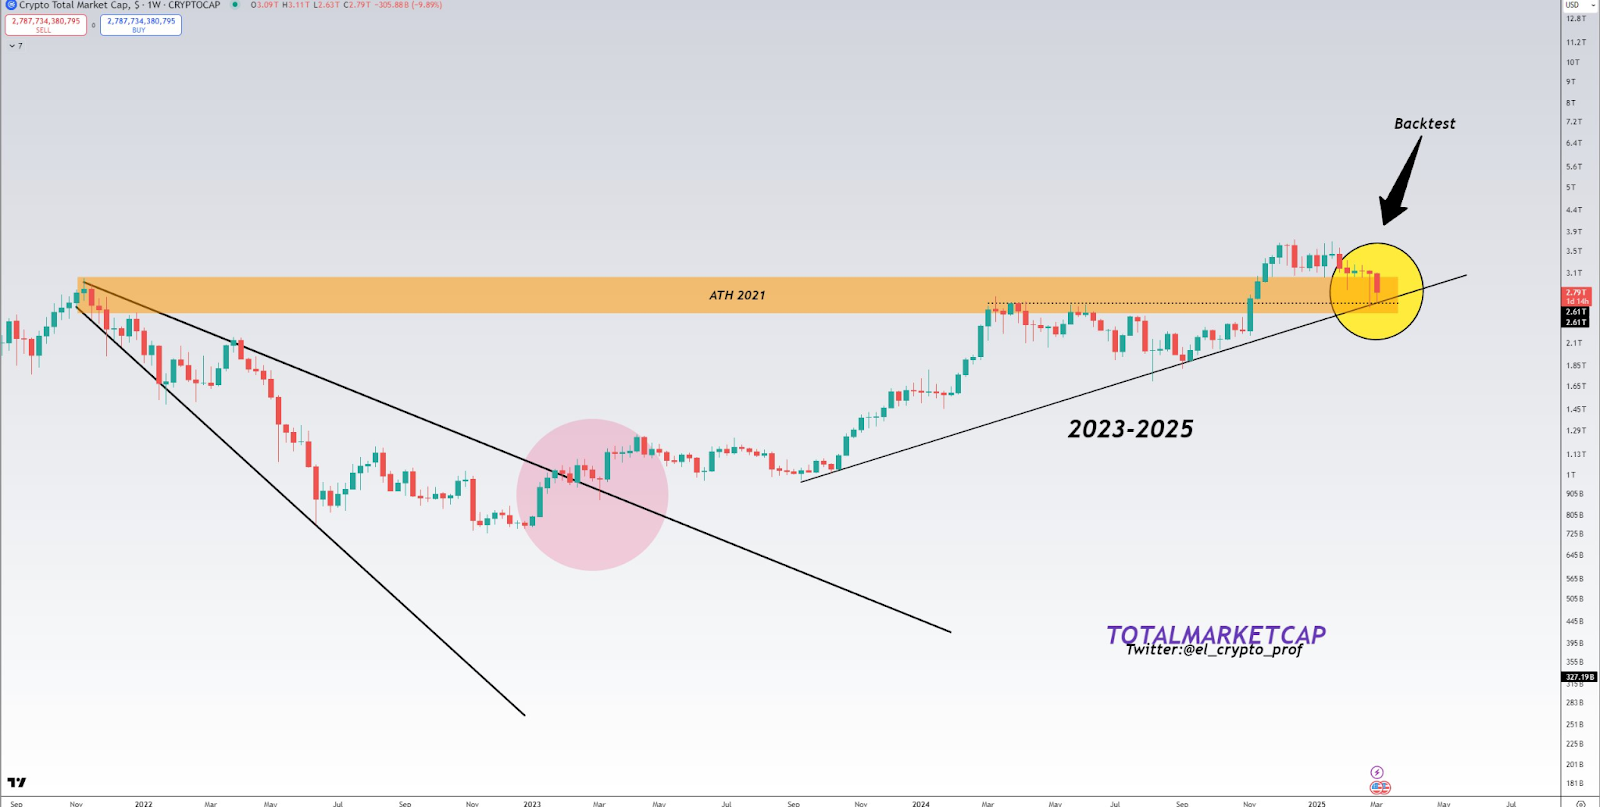
Total Market Cap Confirms Key Support Levels
The total cryptocurrency market capitalization recently tested its 2021 all-time high, forming multiple confluences. After a breakout in late 2024, the price surged but retraced to retest previous resistance. This retest aligns with a 1.5-year-long ascending trendline.
The historical price action indicates strong reactions at critical support levels. Besides, this structure resembles previous cycles, where breakouts were followed by healthy consolidations before further rallies. Hence, maintaining support at this zone will be crucial for sustaining bullish momentum.
Altcoin Market Displays Rounding Bottom Formation
Excluding Bitcoin, the total altcoin market capitalization (TOTAL2) mirrors past market cycles. Between 2018 and 2020, a prolonged accumulation period formed a rounding bottom before a breakout. Similarly, from mid-2022 to 2024, the market followed the same pattern. Consequently, the recent breakout marks the transition from accumulation to an expansion phase.
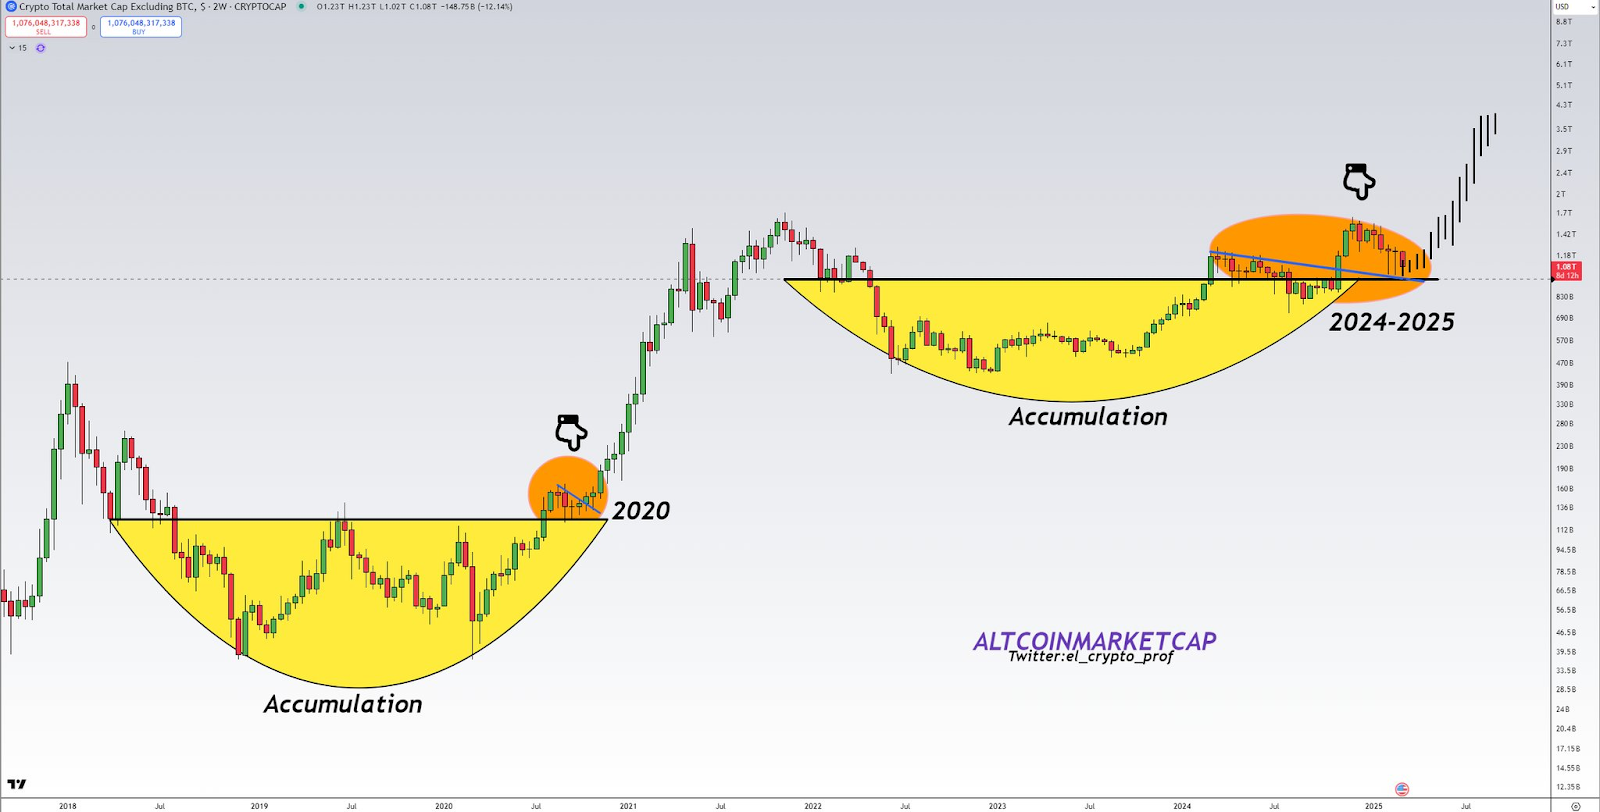
The chart highlights an important retest zone, where the market confirmed previous resistance as new support. This setup is similar to the 2020 cycle, where a brief consolidation led to exponential growth. Additionally, the market is now showing early signs of another parabolic rally. If history rhymes, a continuation of the uptrend remains likely.