
- Toncoin forms a descending triangle, nearing the crucial $5.17 support, indicating a possible bearish breakout.
- If Toncoin breaks below $5.17, the next major support lies between $4.665 and $4.794, signaling a potential 7.16% decline.
- Technical indicators like RSI and MACD show mixed signals, suggesting ongoing bearish momentum with limited recovery chances.
Toncoin is facing bearish pressure as it approaches a critical support level at $5.17. Over recent days, the pair has formed a descending triangle pattern, typically a bearish continuation formation. This pattern, characterized by lower highs and a steady horizontal support line, suggests potential further downside movement if the price fails to hold.
Descending Triangle and Key Support Levels
The descending triangle formation is evident, with the price trading just above the $5.17 support zone. This horizontal level has acted as a strong support point, with multiple price bounces observed.
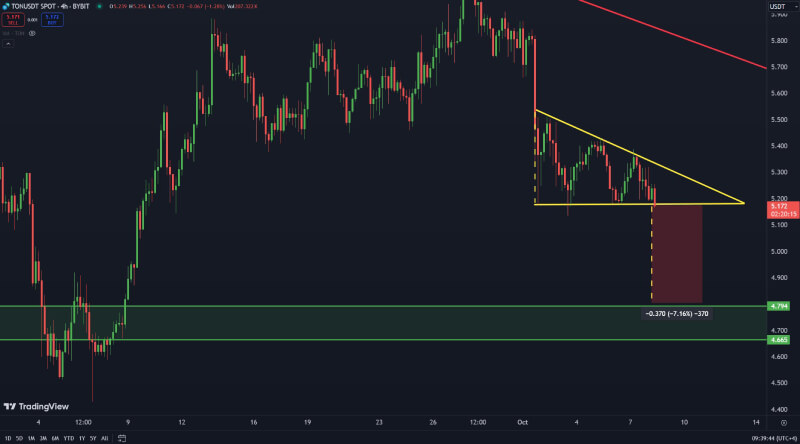
However, the declining trendline indicates that sellers are gradually overpowering buyers, leading to lower peaks. If the price drops below the $5.17 support, the next critical support range lies between $4.665 and $4.794, which has previously attracted buyer interest.
Potential Bearish Breakout Signals Weakness
The ongoing consolidation within the triangle suggests a potential bearish breakout is near. If TON breaks below the support, a 7.16% decline could follow, taking the price toward $4.80.
Additionally, the declining volume points to reduced market participation, a common precursor to price movements. Should this breakdown occur, a swift slide into the green-shaded support zone is likely.
Indicators Show Mixed Signals on Price Momentum
The RSI currently sits at 40.52, highlighting bearish momentum but not yet in oversold territory. A further decline toward 30 could attract buyers.
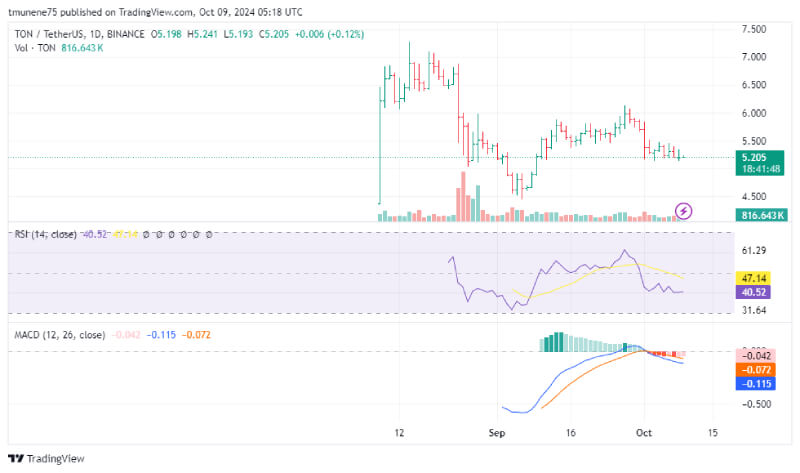
Meanwhile, the MACD indicates a slight bullish crossover, although both lines remain in negative territory, suggesting overall bearish conditions persist. Any recovery will require a break above the $5.35 resistance, but current indicators suggest this scenario is less probable without a surge in buying interest.