
- Tezos breaks below the falling wedge, flipping bearish with resistance tight at $0.73–$0.74.
- Bearish MACD crossover & RSI under 40 signal weak momentum.
- XTZ market cap dips from $840M to $745M, with $750M acting as strong resistance.
Tezos is losing steam fast, now trading at $0.7117 as at press time after a sharp 9% weekly drop. With weak volume and growing bearish pressure, bulls are in defense mode as critical support levels face intense heat.

Bearish Breakdown Below Wedge Support
Alpha Crypto Signal noted that XTZ has slipped below the support of a falling wedge on the 4-hour chart, a move that shifts the structure into bearish territory. Typically, falling wedges are considered bullish reversal patterns, but XTZ failed to break upward and instead lost momentum, breaking downward from the formation.
Current resistance is observed near the $0.73–$0.74 range. This level holds weight as it combines both the 50-SMA and the wedge’s prior support trendline. Unless XTZ can reclaim this zone with strength, downside targets of $0.68 and $0.65 remain likely. A strong close back inside the wedge would be needed to invalidate the current bearish setup.
Descending Channel and Weak Technical Indicators
The 4-hour chart shows a descending channel that has defined XTZ’s price movement since early August.XTZ is currently testing the channel’s upper boundary near $0.7192, which aligns with the 9-EMA. Although volume has slightly increased during this rebound, there’s no decisive breakout above this level. A rejection at this trendline could drive the token back to support zones near $0.68.
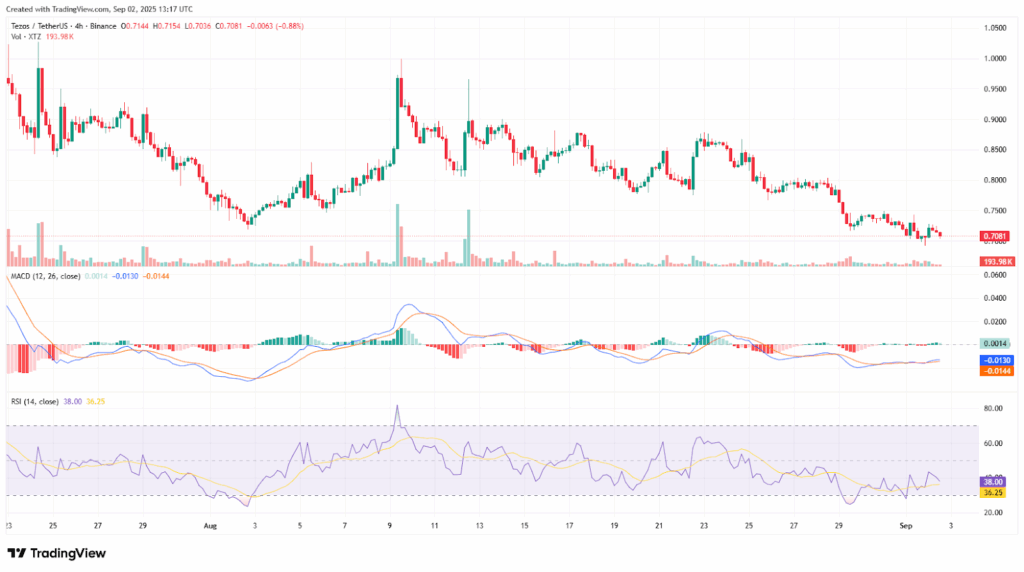
The MACD has flipped bearish with red histogram bars growing, while the RSI lingers at a weak 38—showing bulls are still missing in action. Without a clear shift in momentum, Tezos continues to face short-term selling pressure.
Market Cap Weakness and Sentiment Pressure
Between August 27 and September 2, Tezos’ market capitalization fell from over $840 million to around $745 million. The steepest drop occurred on August 28–29, coinciding with broad selling pressure. Attempts at recovery on August 30 and September 1 were short-lived.
Currently, the $750 million level acts as resistance, while $730 million serves as the next support zone. Failing to hold this level could trigger deeper losses. While social sentiment and protocol fundamentals remain strong, technical structure and market activity continue to favor the bears in the short term.