
- USDT transfers hit a 6-month high, signaling increased market participation and potential crypto price recovery.
- Historical trends show Tether activity spikes often precede Bitcoin rallies, suggesting renewed investor interest.
- A drop in USDT dominance near 4.50% may trigger an altcoin bounce, aligning with historical support and seasonal trends.
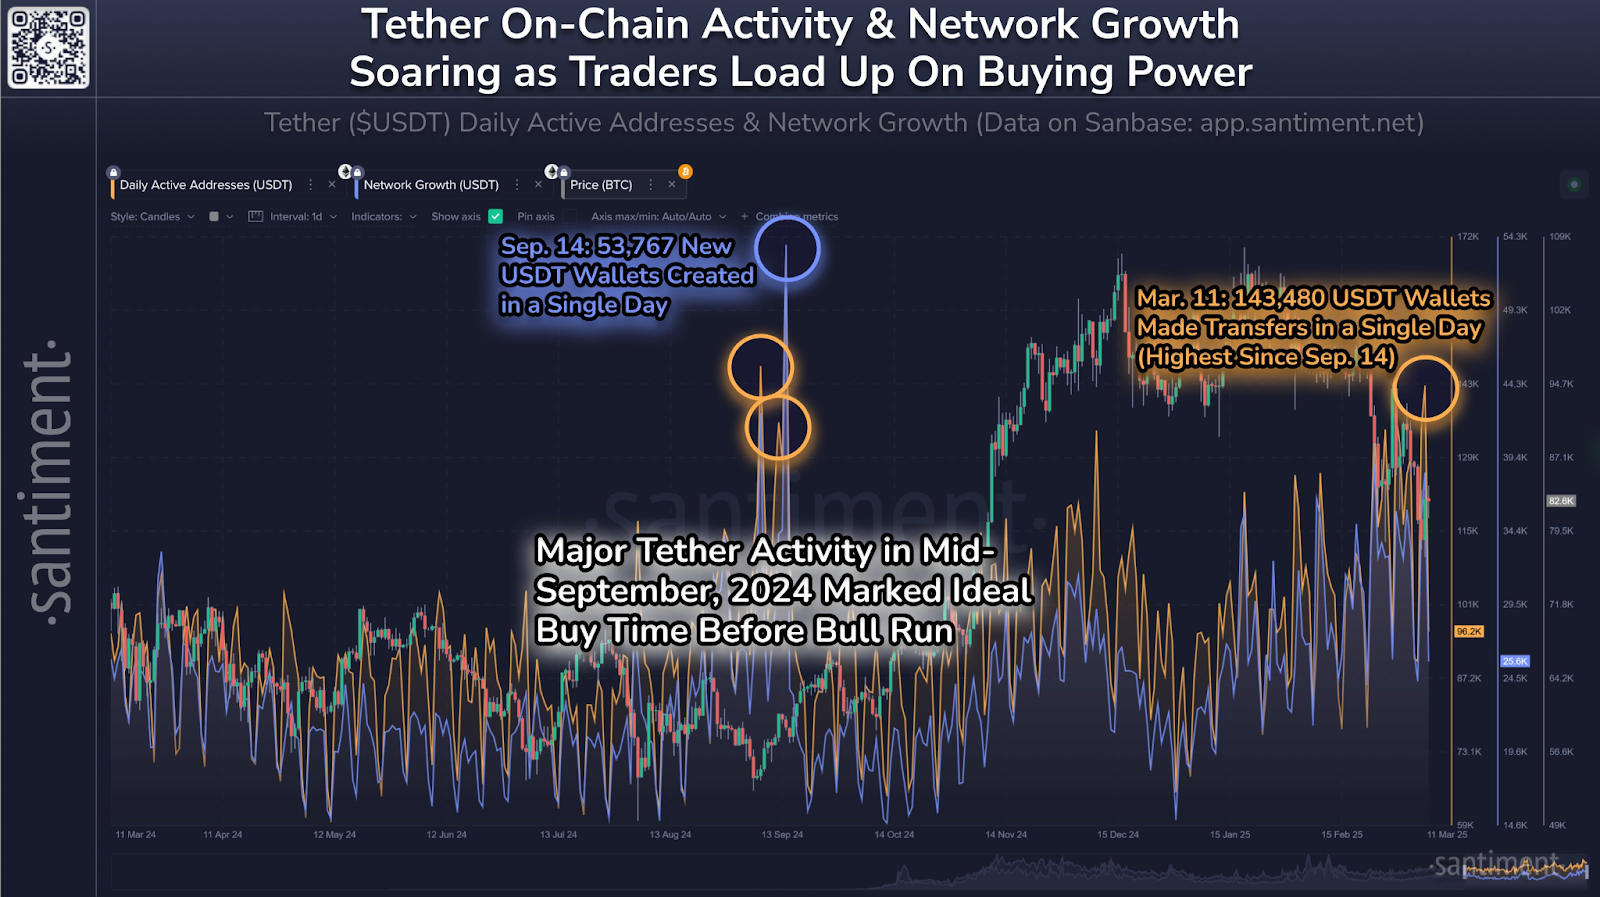
Tether’s (USDT) on-chain activity has surged. Santiment data reveals March 11, 2025 with over 143,480 wallets executing transfers, reaching the highest level since September 14, 2024. This increase signals growing interest in stablecoin movement, often preceding bullish crypto market trends. Historically, spikes in Tether transactions have aligned with price recoveries.
Tether Activity Correlates With Market Momentum
Moreover, Santiment platform shows a strong relationship between USDT movement and Bitcoin’s price trends. During mid-September 2024, 53,767 new USDT wallets were created in a single day. This surge preceded a notable bull run, proving that heightened Tether activity often signals capital influx into crypto assets.
Additionally, stablecoin activity during price drops suggests accumulation. Traders tend to move funds into Tether before reinvesting in crypto. Consequently, this behavior creates buying pressure, aiding in price recoveries. The March 2025 surge follows this pattern, indicating a potential market rebound.
USDT Dominance and Altcoin Performance
Besides Tether’s transaction spike, USDT dominance trends provide insight into altcoin movement. According to RationalGaze, a 1% decline in USDT dominance towards the 4.50% zone could create a relief bounce for altcoins. Most alternative cryptocurrencies rest on historical high-timeframe support, making this level crucial.
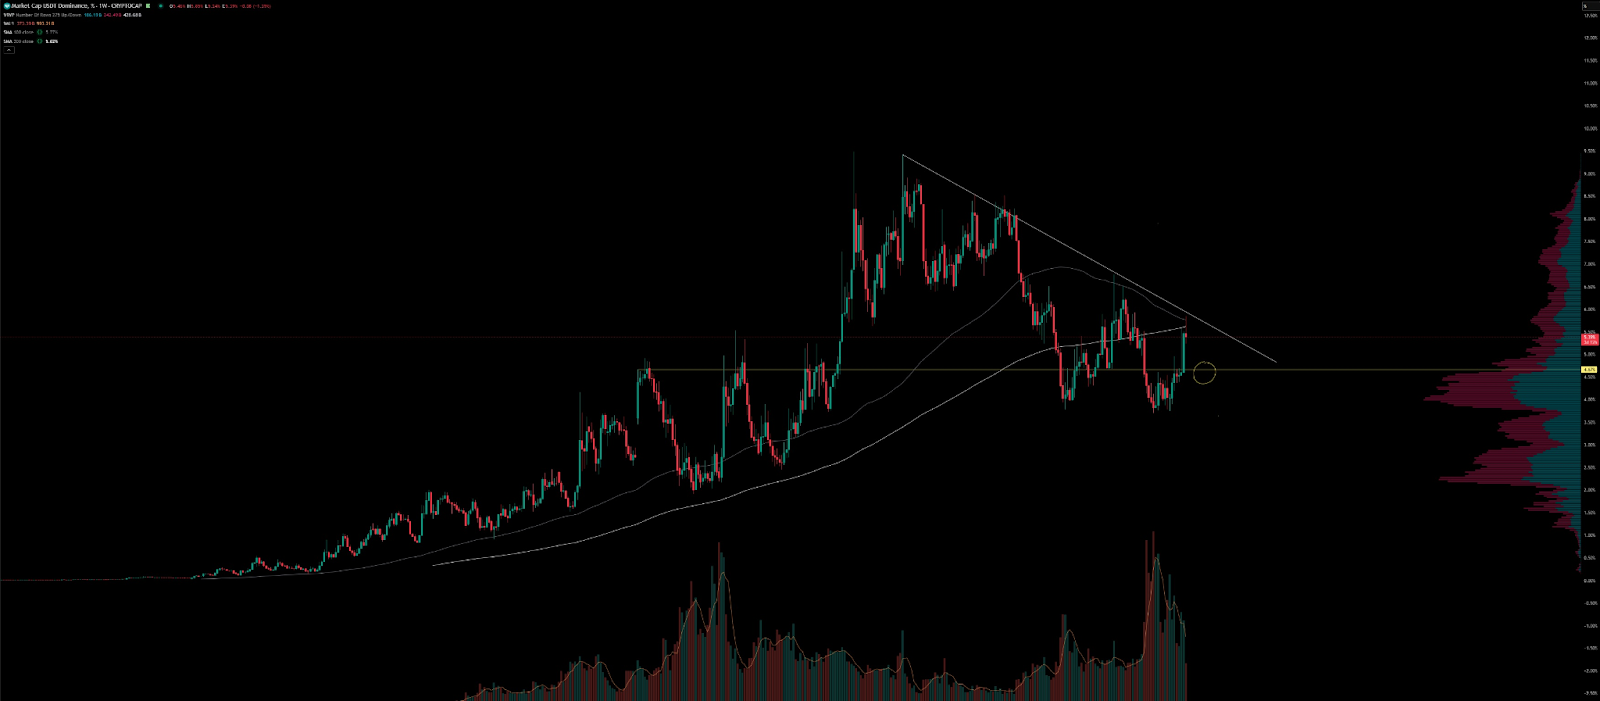
Furthermore, the market structure suggests a descending triangle pattern, indicating potential price action shifts. A descending trendline and key resistance levels suggest sustained selling pressure. However, the 50-week simple moving average (SMA) remains above the 200-week SMA, reinforcing a long-term bullish structure.
Trading volume aligns with resistance tests, showing high levels of market participation. A recent price bounce at support highlights liquidity accumulation. If USDT dominance declines, altcoins could see short-term gains, aligning with seasonal trends.