
- Tesla’s TD Sequential buy signal hints at a potential trend shift after sharp declines, with support at $273.60 and resistance at $309.00.
- A breakout from the downward channel suggests bullish momentum, with projections targeting $494 by mid-May 2025.
- Price action and technical indicators signal a possible reversal, though selling pressure remains a key factor in short-term movement.
Tesla’s stock closed at $292.98 after a decline of $9.82 or 3.24% on the three-day chart. The session’s high reached $309.00, while the low touched $273.60. The overall trend remained bearish, with consecutive downward candles reinforcing selling pressure. A gray trendline extended from a previous peak, confirming a break below a support zone.
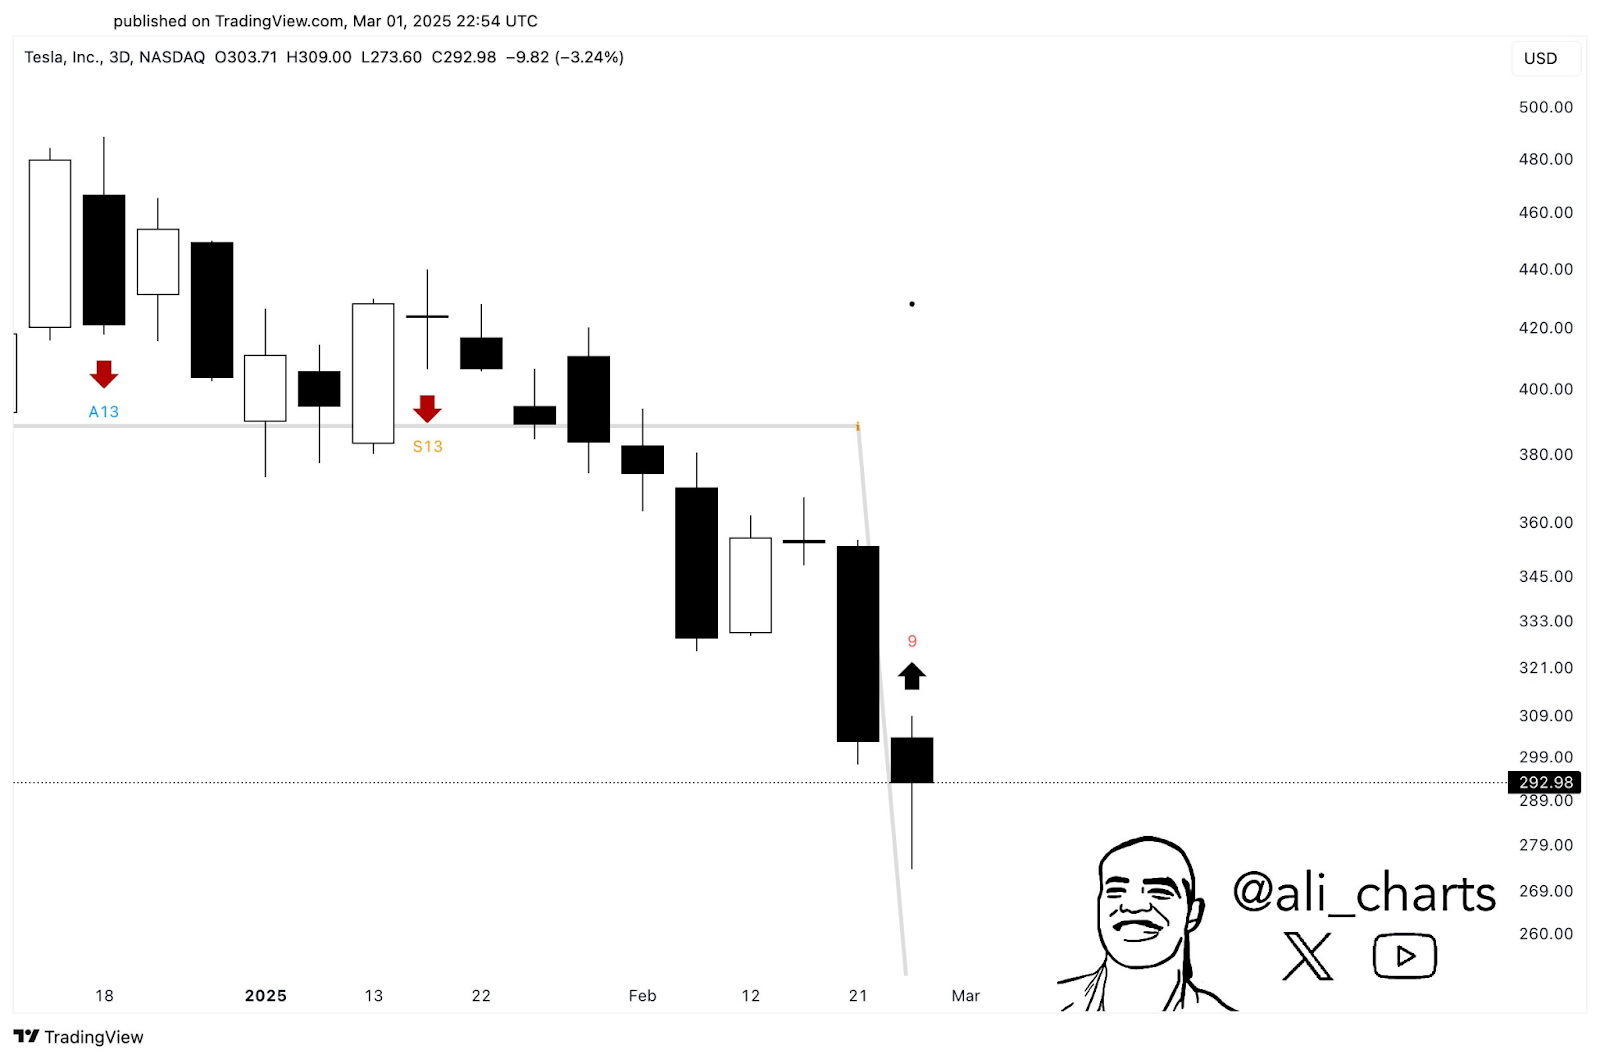
Two red arrows labeled “A13” and “S13” indicated resistance levels earlier on the chart. A black upward arrow with the number “9” signaled a potential inflection point. The latest candle exhibited a long lower wick, indicating an attempt to recover intraday losses. The price action showed a series of lower highs and lower lows, maintaining the downward trend.
No volume data appeared on the chart, but selling pressure intensified, leading to one of the sharpest declines. Key support emerged at $273.60, where buyers stepped in to prevent further losses. Resistance remained at $309.00, where the stock failed to sustain upward movement. The chart, sourced from TradingView, featured branding from ali_charts. The date on the chart was March 1, 2025.
Breakout from Downward Channel Indicates Potential Trend Shift
Tesla’s daily timeframe chart displayed a downward channel, marked by two parallel white lines. The price bottomed at $274 before rebounding, forming a local support level. A yellow circle highlighted a key price action area, marking a possible trend reversal. A blue curved projection indicated a potential upward movement, targeting $494 by mid-May 2025.
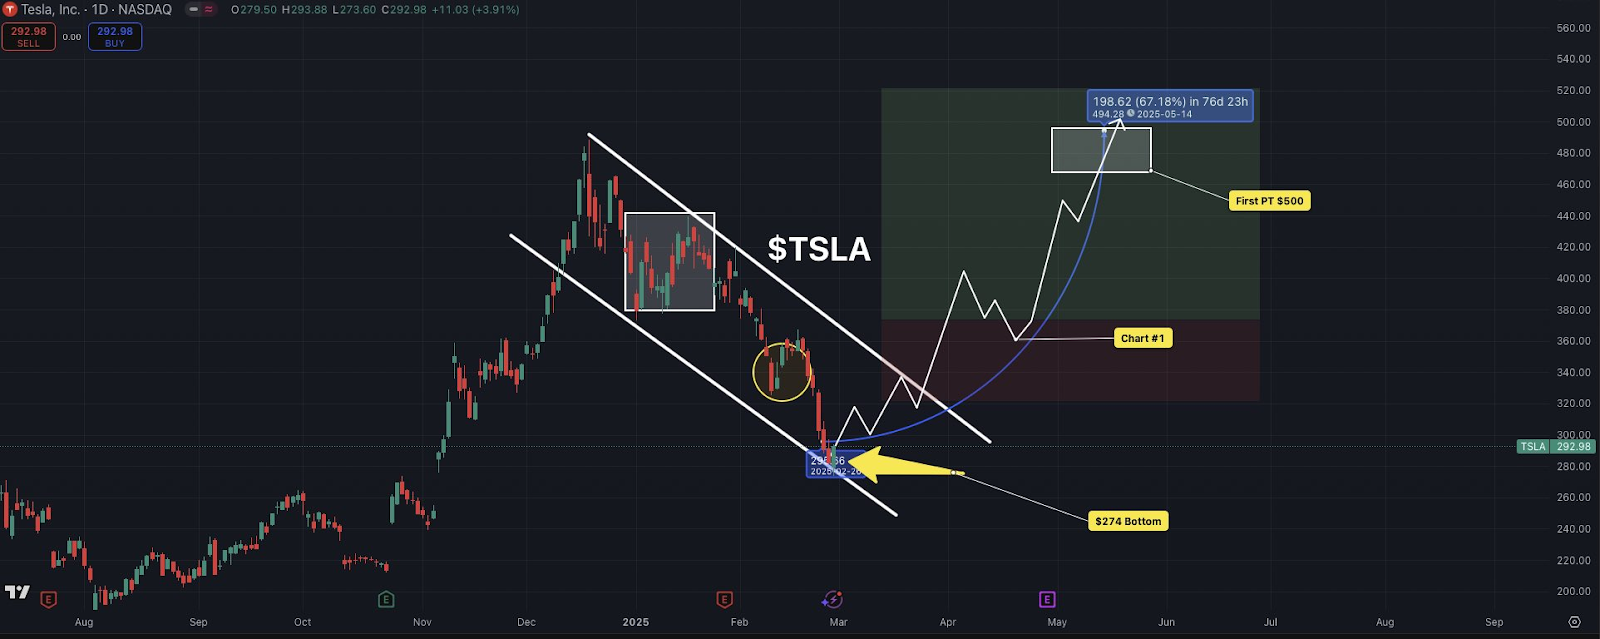
A price breakout occurred near $292.98, marked by a yellow arrow. The previous consolidation zone, outlined in a white rectangular box, reflected a stabilization phase before the decline. The chart showed Tesla’s stock moving upwards, gaining 3.91% on the day. A green-shaded area represented a potential profit zone, while a red-shaded region signaled downside risk.